Advancing Coastal Risk Reduction Science and Implementation by Accounting for Climate, Ecosystems, and People
 Jessica M. Silver1,2*
  Katie K. Arkema1,2*
  Robert M. Griffin1† Brett Lashley3†
  Michele Lemay4
  Sergio Maldonado1† Stacey H. Moultrie5 Mary Ruckelshaus1,2 Steven Schill6 Adelle Thomas7 Katherine Wyatt1,2
  Gregory Verutes1,8
- 1Natural Capital Project, Stanford Woods Institute for the Environment, Stanford University, Stanford, CA, United States
- 2School of Environmental and Forest Sciences, University of Washington, Seattle, WA, United States
- 3Office of the Prime Minister of the Bahamas, Nassau, Bahamas
- 4Inter-American Development Bank, Washington, DC, United States
- 5SEV Consulting Group, Nassau, Bahamas
- 6Caribbean Program, The Nature Conservancy, Nassau, Bahamas
- 7Department of Environmental and Life Sciences, University of The Bahamas, Nassau, Bahamas
- 8Department of Applied Economics, Faculty of Political and Social Sciences, University of Santiago de Compostela, Santiago de Compostela, Spain
Climate change and population growth are degrading coastal ecosystems and increasing risks to communities and infrastructure. Reliance on seawalls and other types of hardened shorelines is unsustainable in an era of rising seas, given the costs to build and maintain these structures and their unintended consequences on ecosystems. This is especially true for communities that depend on coastal and marine ecosystems for livelihoods and sustenance. Protecting and restoring coral reefs and coastal forests can be lower cost, sustainable alternatives for shoreline protection. However, decision-makers often lack basic information about where and under what conditions ecosystems reduce risk to coastal hazards and who would benefit. To better understand where to prioritize ecosystems for coastal protection, we assessed risk reduction provided by coral reefs, mangroves, and seagrass along the entire coast of The Bahamas, under current and future climate scenarios. Modeled results show that the population most exposed to coastal hazards would more than double with future sea-level rise and more than triple if ecosystems were lost or degraded. We also found that ecosystem-based risk reduction differs across islands due to variation in a suite of ecological, physical, and social variables. On some populated islands, like Grand Bahama and Abaco, habitats provide protection to disproportionately large numbers of people compared to the rest of the country. Risk reduction provided by ecosystems is also evident for several sparsely populated, remote coastal communities, which in some cases, have large elderly populations. The results from our analyses were critical for engaging policy-makers in discussions about employing natural and nature-based features for coastal resilience. After hurricanes Joaquin and Matthew hit The Bahamas in 2016 and 2017, our assessment of coastal risk reduction and the multiple benefits provided by coastal ecosystems helped pave the way for an innovative loan from the Inter-American Development Bank to the Government of The Bahamas to invest in mangrove restoration for coastal resilience. This work serves as an example for other regions and investors aiming to use assessments of ecosystem services to inform financing of natural and nature-based approaches for coastal resilience and climate adaptation.
Introduction
Coastal areas are hazard prone. An estimated 310 million people and $11 trillion in GDP are exposed globally to the extent of a 100-year flood event (Hinkel et al., 2014). Risk is expected only to increase, due to rising sea levels and other climate-related threats concurrent with population growth. By 2060, up to 411 million people could be exposed to a 100-year flood event (Hallegatte et al., 2013; Wong et al., 2014; Neumann et al., 2015; Reguero et al., 2015). Thus, building resilient communities is a shared challenge for the world’s population living along the coast now and in the future (Adger et al., 2005; McGranahan et al., 2007; Kron, 2013). To address this challenge, communities typically engineer barriers along the coast. However, there is growing understanding that traditional approaches to coastal protection (e.g., seawalls, bulkheads, etc.) are unsustainable. Hardened shorelines can be expensive to build and maintain, and can lead to unintended shoreline erosion, degradation or loss of habitat, and impacts on communities that depend on healthy coastal ecosystems for protection, subsistence, and livelihoods (Burgess et al., 2004; Hillen et al., 2010; Jones et al., 2012; Gittman et al., 2015; Rangel-Buitrago et al., 2017).
Concerns about hardened shorelines are heightening interest in alternatives for coastal protection that may be less environmentally destructive, more cost-effective to maintain in the long-term, and able to provide valuable co-benefits such as habitat for fisheries (Cheong et al., 2013; Mycoo and Donovan, 2017; Reguero et al., 2018b). Coastal habitats like coral and oyster reefs, seagrass beds, marshes, mangrove, and coastal forests have the potential to attenuate waves and surge associated with storms, in some cases mitigating flooding and coastal erosion (e.g., Danielsen et al., 2005; Alongi, 2008; Barbier et al., 2008; Das and Vincent, 2009; Zhang et al., 2012; Arkema et al., 2013; Ferrario et al., 2014; Spalding et al., 2014; Narayan et al., 2016; Beck et al., 2018; Reguero et al., 2018a, b). Because conserving or restoring natural habitats does not preclude alternative actions later, nature-based approaches are generally seen as potentially no- or low-regret coastal adaptation options, irrespective of future climate (Cheong et al., 2013; Nurse et al., 2014). Conservation and in some cases, habitat restoration, is cheaper than built infrastructure, and has been found to be highly cost effective (i.e., mangrove restoration vs. breakwater construction) (Narayan et al., 2016). Furthermore, coastal ecosystems may adapt to climate change, potentially making them more effective in the long term compared to hard infrastructure (Temmerman et al., 2013). These findings are promising for island nations throughout the Caribbean, with large highly exposed coastal zones and extensive networks of ecosystems that provide multiple lines of defense against coastal hazards (Guannel et al., 2016; Beck et al., 2018). However, the ability of habitats to provide coastal protection is highly context dependent, and ecosystems perform differently based on the conditions (Costanza et al., 2008; Ruckelshaus et al., 2016; Arkema K. K. et al., 2017). Strengthening hazard resilience requires a better understanding of where ecosystems are most important for providing coastal protection, especially given threats from development (Gittman et al., 2015).
The need to better understand risk from coastal hazards and bolster shoreline resilience was brought into stark relief following the devastation from the 2017 Atlantic hurricane season, which recorded three of the top five costliest hurricanes for this region in history – Hurricanes Harvey, Maria, and Irma (National Oceanic and Atmospheric Administration [NOAA] and National Hurricane Center [NHC], 2018; EM-DAT International Disaster Database, 2018). Recovery from the 2017 season was especially protracted in the Caribbean, which highlights costly inequities in vulnerability and resilience among nations, and underscores the disproportionate burden that small island developing states will bear in adapting to climate change (Anthoff et al., 2010; Nurse et al., 2014; Wong et al., 2014; Mycoo and Donovan, 2017; Beck et al., 2018). In contrast to the mainland United States where basic services were restored within days, many residents throughout the Caribbean were without basic services for months, even up a year in the case of Hurricane Maria and Puerto Rico (e.g., Hincks, 2017; Kishore et al., 2018; Puerto Rico: The Forgotten Island, 2018; Shultz et al., 2018)1. Loss of life also varied dramatically, from almost 3,000 deaths on Puerto Rico, a poor island in the Caribbean, vs. four on the United States mainland (Ascertainment of the estimated excess mortality from Hurricane Maria in Puerto Rico, 2018; Pasch et al., 2019).
Variation in impacts from storms and the pace of post-disaster reconstruction highlights some of the challenges faced by island nations, including: high exposure to hazards, geographic isolation and small size, fragile infrastructure grids, and poor home construction (Ghosal, 2016; Panditharante, 2018; Rodríguez-Díaz, 2018; Shultz et al., 2018). The ability to respond to and recover from disasters is often highly variable and attention is increasingly being paid to social risk factors that make certain communities especially vulnerable to hazards. There is general consensus that factors such as age, race/ethnicity, gender, education and poverty status are quantifiable indicators for differences in access to resources, power and capacity that underlie social vulnerability (e.g., Cutter et al., 2003; Cutter et al., 2009; Peacock et al., 2012; Wamsley et al., 2015; Arkema K. K. et al., 2017). However, while a growing number of studies are beginning to use these demographic metrics to map risk to vulnerable communities (Boruff et al., 2005; Thatcher, 2013; Koks et al., 2015), less attention has been paid to the relationship between vulnerable communities and coastal ecosystems that may be providing risk reduction (Arkema K. K. et al., 2017).
To stimulate widespread uptake and implementation of nature-based coastal protection strategies, decision-makers also need approaches and tools that can synthesize physical, demographic and ecological data to identify in a spatially explicit manner where ecosystems matter to vulnerable communities, and evaluate alternatives in a timely manner. Benefits from the protection service provided by coastal habitats have been measured in a variety of ways. These include employing process-based predictive modeling using expected damage functions to assist in cost-benefit analysis for protective interventions (this approach is used by U.S. Federal Emergency Management Agency’s HAZUS software) (Barbier, 2015). Other approaches include measuring protective benefits as capitalized into housing values using hedonic analysis (Dundas, 2017), asking people their willingness to pay for protection services using stated preference surveys (Landry et al., 2011), or using basic regression analysis as a means of relating the presence of coastal habitats to reduced flood damage (Danielsen et al., 2005; Costanza et al., 2008; Das and Vincent, 2009; Boutwell and Westra, 2016). Although all of these approaches can be used for decision support, they are data intensive, generally relying on existing data on the physical drivers of storm risk, geospatial information on exposed people and infrastructure, or extensive primary data collection. Data requirements notwithstanding, these approaches may also require significant expertise to run (i.e., complex wave models may take months to parameterize by a coastal engineer), which can make it more difficult for staff in organizations with limited capacity to quickly iterate scenarios and consider in quantitative terms the competing goals and preferences of a broad group of stakeholders. What is needed to inform decisions are transparent, repeatable, and accessible tools and open-source data for resource-poor nations to identify where ecosystems matter most for people (United Nations Office for Disaster Risk Reduction [UNDRR], 2019).
Here we present the results from a coastal hazard and social vulnerability analysis for The Bahamas using the InVEST Coastal Vulnerability model (Sharp et al., 2018), and we discuss how the results from this analysis were used to inform several planning efforts to build coastal resilience in the country. Modeling was focused on addressing three fundamental questions that decision-makers often consider when implementing nature-based coastal protection: (1) where are people at risk from coastal hazards in The Bahamas? (2) how might sea-level rise (SLR) change the distribution of risk across the country? and (3) where are coastal and marine ecosystems providing protection currently, and under future SLR for the most socially vulnerable populations? In the subsequent sections we first detail the modeling methodology and data collection. Next we report on risk results at the national and island scales, highlighting the drivers of risk, the role of ecosystems in reducing risk, and implications of sea-level rise. We then explore how these results were used to inform post-disaster decision-making for Hurricanes Matthew (2016) and Joaquin (2015), and a 2-year sustainable development planning initiative for Andros Island led by the Office of the Prime Minister. Our results illustrate the diversity and versatility of information that can be provided by a relatively simple approach and tools that integrate multiple components of vulnerability and resilience for coastal communities.
Materials and Methods
We explored risk to coastal communities in The Bahamas by combining results from a hazard analysis that considered the role of ecosystems in reducing impacts from flooding and erosion with demographic information about vulnerable populations. In the sections that follow, we introduce the study area and the theory behind the InVEST Coastal Vulnerability model. We then describe how data were collected, how model variables were parameterized, and we introduce scenarios that were tested in this work. Finally, we discuss how social variables were mapped and related to the hazard index to understand risk to people and benefits of coastal ecosystems.
Study Area
Bahamians are highly dependent on the services provided by the country’s extensive marine and coastal ecosystems which include (but are not limited to) coral reefs, mangrove forests, coastal coppice forests (dry broadleaf evergreen forests), Caribbean pine forests and seagrass beds (Figure 1A). More than three-quarters of the country’s GDP comes from the tourism sector, and an estimated quarter of Bahamian households derive some income from fisheries (Moultrie et al., 2016; CIA World Factbook, 2017; Environmental Resources Management Inc [ERM], 2017). While not reflected directly in GDP or income, storm protection from coastal habitats is a critical ecosystem service in The Bahamas, given the country’s low terrain elevation and location in a hurricane-prone area. An estimated 15% of the country is within a 3 m SLR flood zone (based on SRTM 1 Arc Second Global elevation data), which is the highest flood risk of any country within the insular Caribbean (The Nature Conservancy, unpublished). Risk is compounded by the fact that the majority of the population lives in low elevation coastal zones less than 10 m above sea level, within 5 km of the coastline (Center for International Earth Science Information Network [CIESIN], and Columbia University, 2013; United Nations Economic Commission for Latin America and the Caribbean [UNECLAC], 2014). Furthermore, the Bahamian archipelago is vast, with 700 islands and over 2,400 cays. Nineteen islands support 90% of the population, concentrated on three main islands in the Northwestern part of the country (New Providence, Grand Bahama, and Abaco). The remainder of the population is distributed on three less populated islands (Eleuthera, Andros, and Exuma) and thirteen sparsely populated islands and cays, primarily in the Southeastern part of the country (Bahamas Department of Statistics, 2017; Figure 1B). Many of the sparsely inhabited islands are remote, and difficult to access for disaster management, emphasizing the importance of storm damage mitigation by habitats in reducing costly disaster aid.
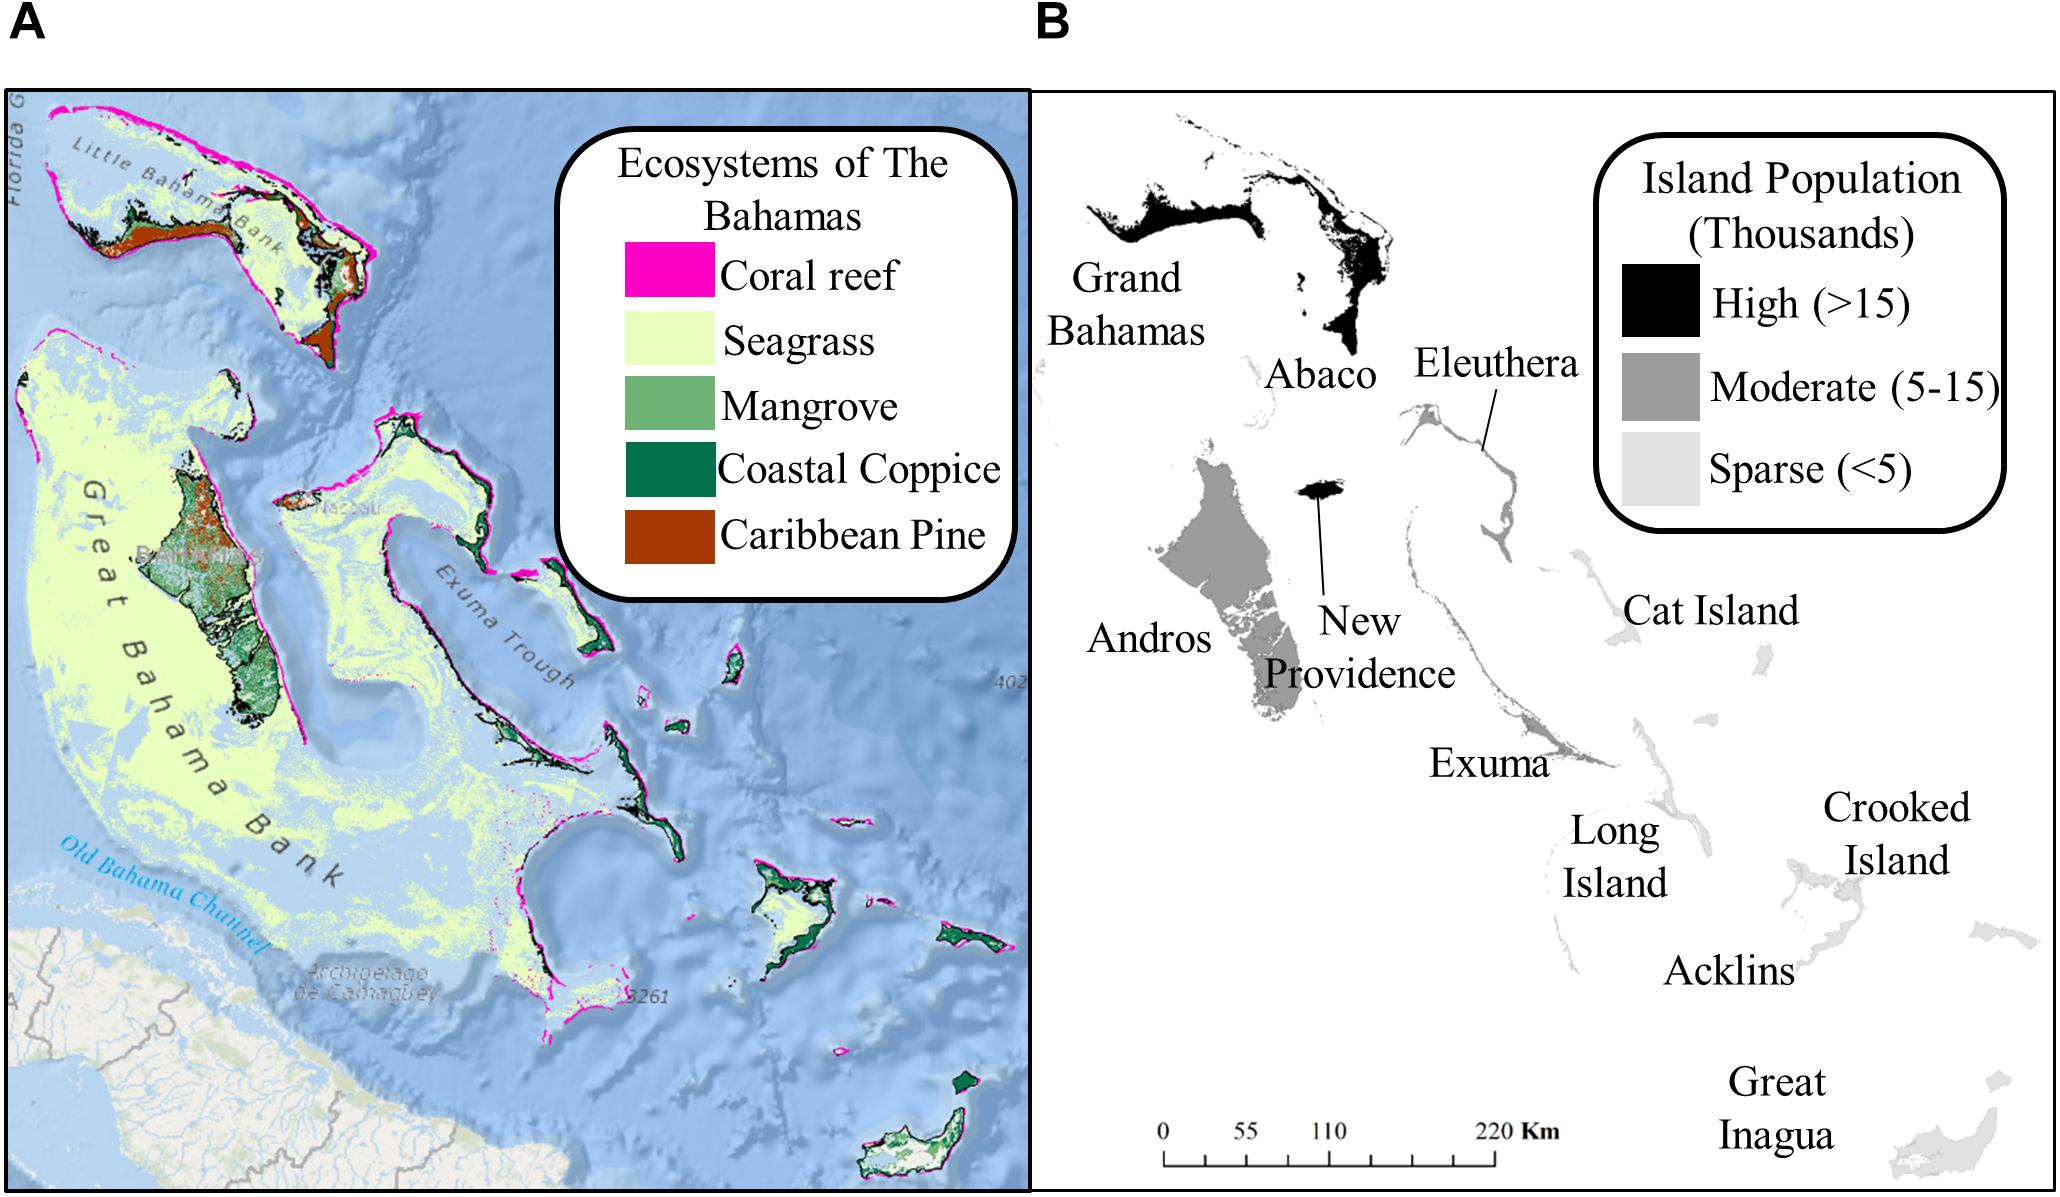
Figure 1. (A) Major coastal, nearshore, and marine ecosystems of The Bahamas. (B) Islands of The Bahamas and distribution of the population. The attribution for the basemap is ESRI (2012).
Modeling Coastal Hazard
To estimate risk from coastal hazards to people throughout The Bahamas now and with future SLR, we used the InVEST Coastal Vulnerability model. The Coastal Vulnerability model is a decision support tool that uses an index-based approach to understand the relative risk of communities to coastal hazards and identifies where habitats have the greatest potential for providing coastal protection (Arkema et al., 2013; Langridge et al., 2014; Hopper et al., 2016; Cabral et al., 2017; Sharp et al., 2018). The model builds on previous, similar indices that account for biophysical and climatic components governing exposure to flooding and inundation from coastal hazards (e.g., Gornitz, 1990; Cooper and McLaughlin, 1998; Hammar-Klose and Thieler, 2001), by explicitly considering the role of ecosystems in providing coastal protection and incorporating information about people, property and other relevant metrics in the framing of risk.
We assessed risk from coastal hazards to coastal communities at a 250 m2 spatial resolution along the entire coast of The Bahamas for several SLR and habitat scenarios. We used the InVEST Coastal Vulnerability model to compute a hazard index that ranked the relative exposure of the shoreline to flooding and erosion based on the following variables: habitat type and extent, coastal elevation, wave exposure, shoreline type, storm surge potential, and SLR (see below for a more complete description of each variable). For each 250 m coastal segment, the variables listed above were assigned ranks from lowest exposure (rank = 1), to highest exposure (rank = 5) based on a combination of absolute and relative rankings of modeled and observed data (Table 1). The final coastal hazard index was calculated by taking the geometric mean of the ranked variables (where R = rank, and all variables given equal weighting). The results are the relative exposure to flood and erosion hazards for each 250 m coastal segment compared with all other segments countrywide, across all scenarios for SLR and habitat (see below).
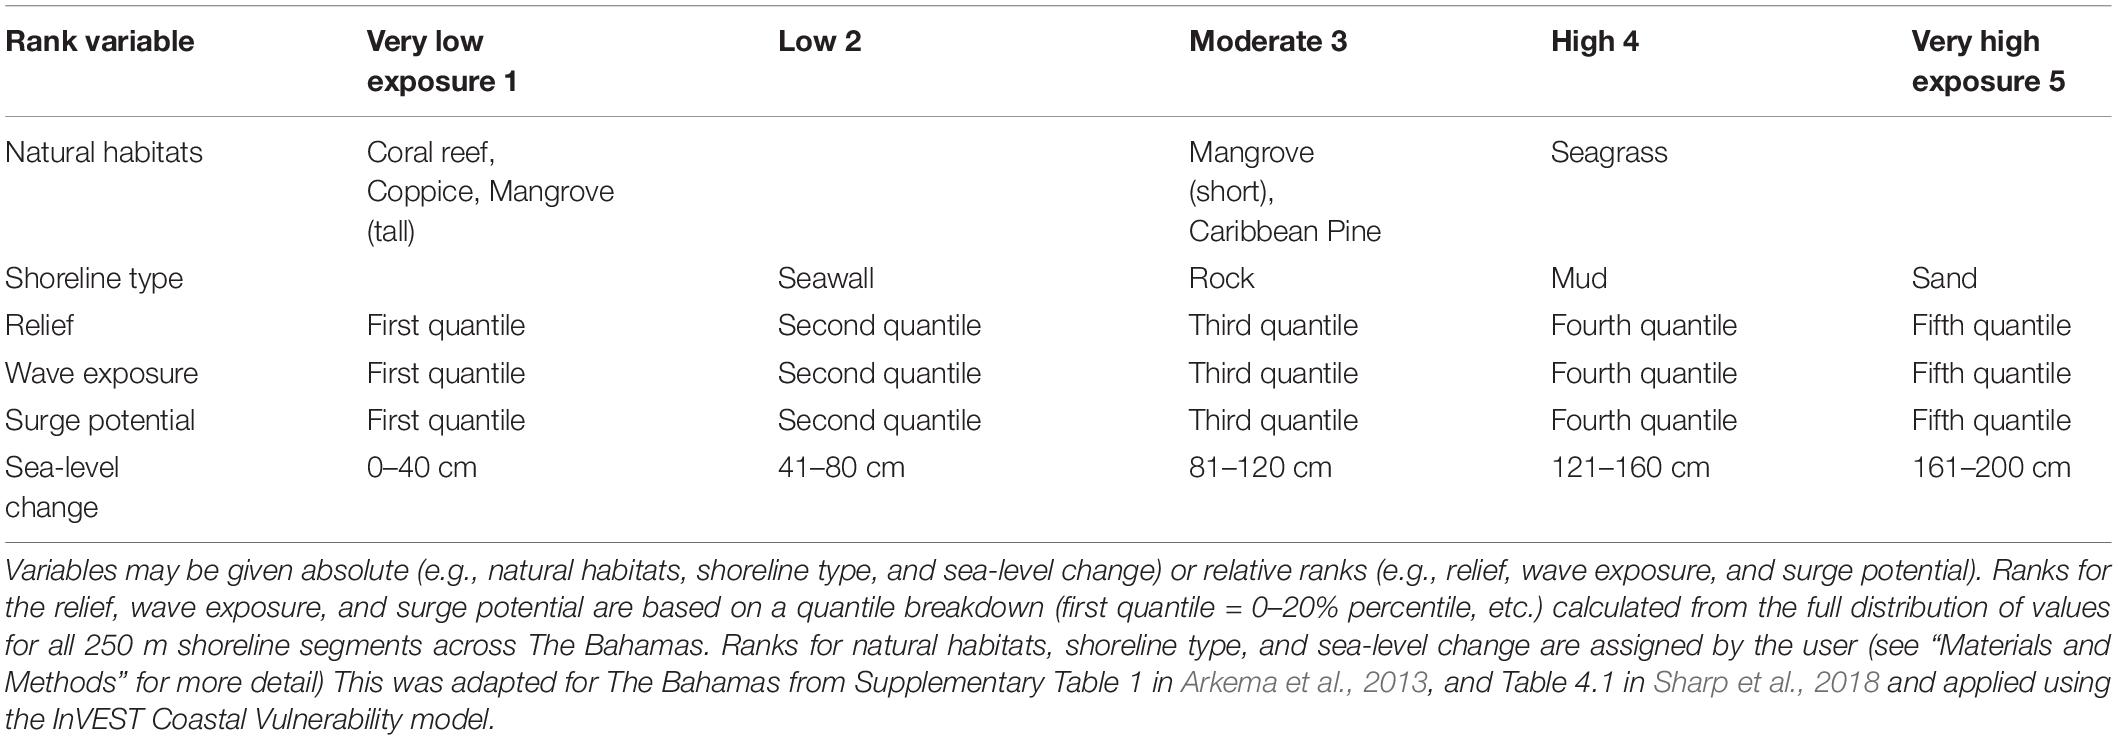
Table 1. Coastal hazard index variables and ranks.
Following Hammar-Klose and Thieler (2001), we used a multiplicative model for the exposure index instead of an additive one because coastal processes and interactions among components of coastal ecosystems are inherently non-linear (Barbier et al., 2008; Koch et al., 2009), and because a linear formulation is susceptible to “eclipsing,” where one variable can be low but the overall index is not (Ott, 1978; Swamee and Tyagi, 2000). The geometric mean is used as the aggregation function in a variety of environmental index models and produces intuitive results because it resolves to the same scale as the inputs. For example, Landwehr and Deininger (1976) demonstrate its favorable predictive ability over other formulations in the context of water quality. Arkema et al. (2013) find strong correlation between hazard index values derived using this multiplicative formula and observed data on hazard events and losses for the coastal United States.
To map hazard we classified the full distribution of values from the hazard index for all segments and scenarios (ranging from 1 to 5) into three groups. We demarcated areas of highest hazard (>2.667 = top 50% of the distribution), intermediate hazard (2.316–2.667 = middle 25–50% of the distribution), and lowest hazard (<2.316 = lowest 25% of the distribution). In addition, cutoffs for categorical breakdowns were informed by empirical observation of currently vulnerable areas in The Bahamas based on damage reports following recent hurricanes (e.g., Caribbean Disaster Emergency Management Agency [CDEMA], 2016a,b,c,d; Pacific Disaster Center [PDC], 2016). In subsequent sections we use the terms highest, intermediate and lowest to express relative exposure to coastal hazards. We then combine the exposure results from the coastal hazard index with demographic data we used to map vulnerable populations to estimate risk from coastal hazards for coastal communities throughout The Bahamas. This is described below in subsequent sections on mapping and quantifying risk to coastal communities.
Data Collection for Hazard Modeling
Model inputs were compiled from globally available, countrywide, and island-level datasets and included variables for coastal and nearshore habitats, relief, wave exposure, shoreline type, and surge potential.
Habitat
We identified five main types of coastal and nearshore habitats that occur along the coast of The Bahamas that may provide some degree of coastal protection: coral reefs, seagrass beds, mangrove forests, coastal coppice forests, and Caribbean pine forests. The hazard index ranks habitats based on differences in their morphology and expected ability to provide protection from erosion and flooding by dissipating wave energy, attenuating storm surge, or anchoring sediments, for example. In addition, the index accounts for greater protection provided by co-occurring habitats (Guannel et al., 2016) and assigns a distance over which different types of habitats will provide protection for coastlines (i.e., “protective distance”) (Arkema et al., 2013; Sharp et al., 2018). The coastal vulnerability model also requires spatial information (shapefiles) about the type and extent of habitats. In The Bahamas, we created composite habitat maps from multiple sources, years, and spatial resolutions and extents in order to reconcile incongruences across input layers (Table 2).
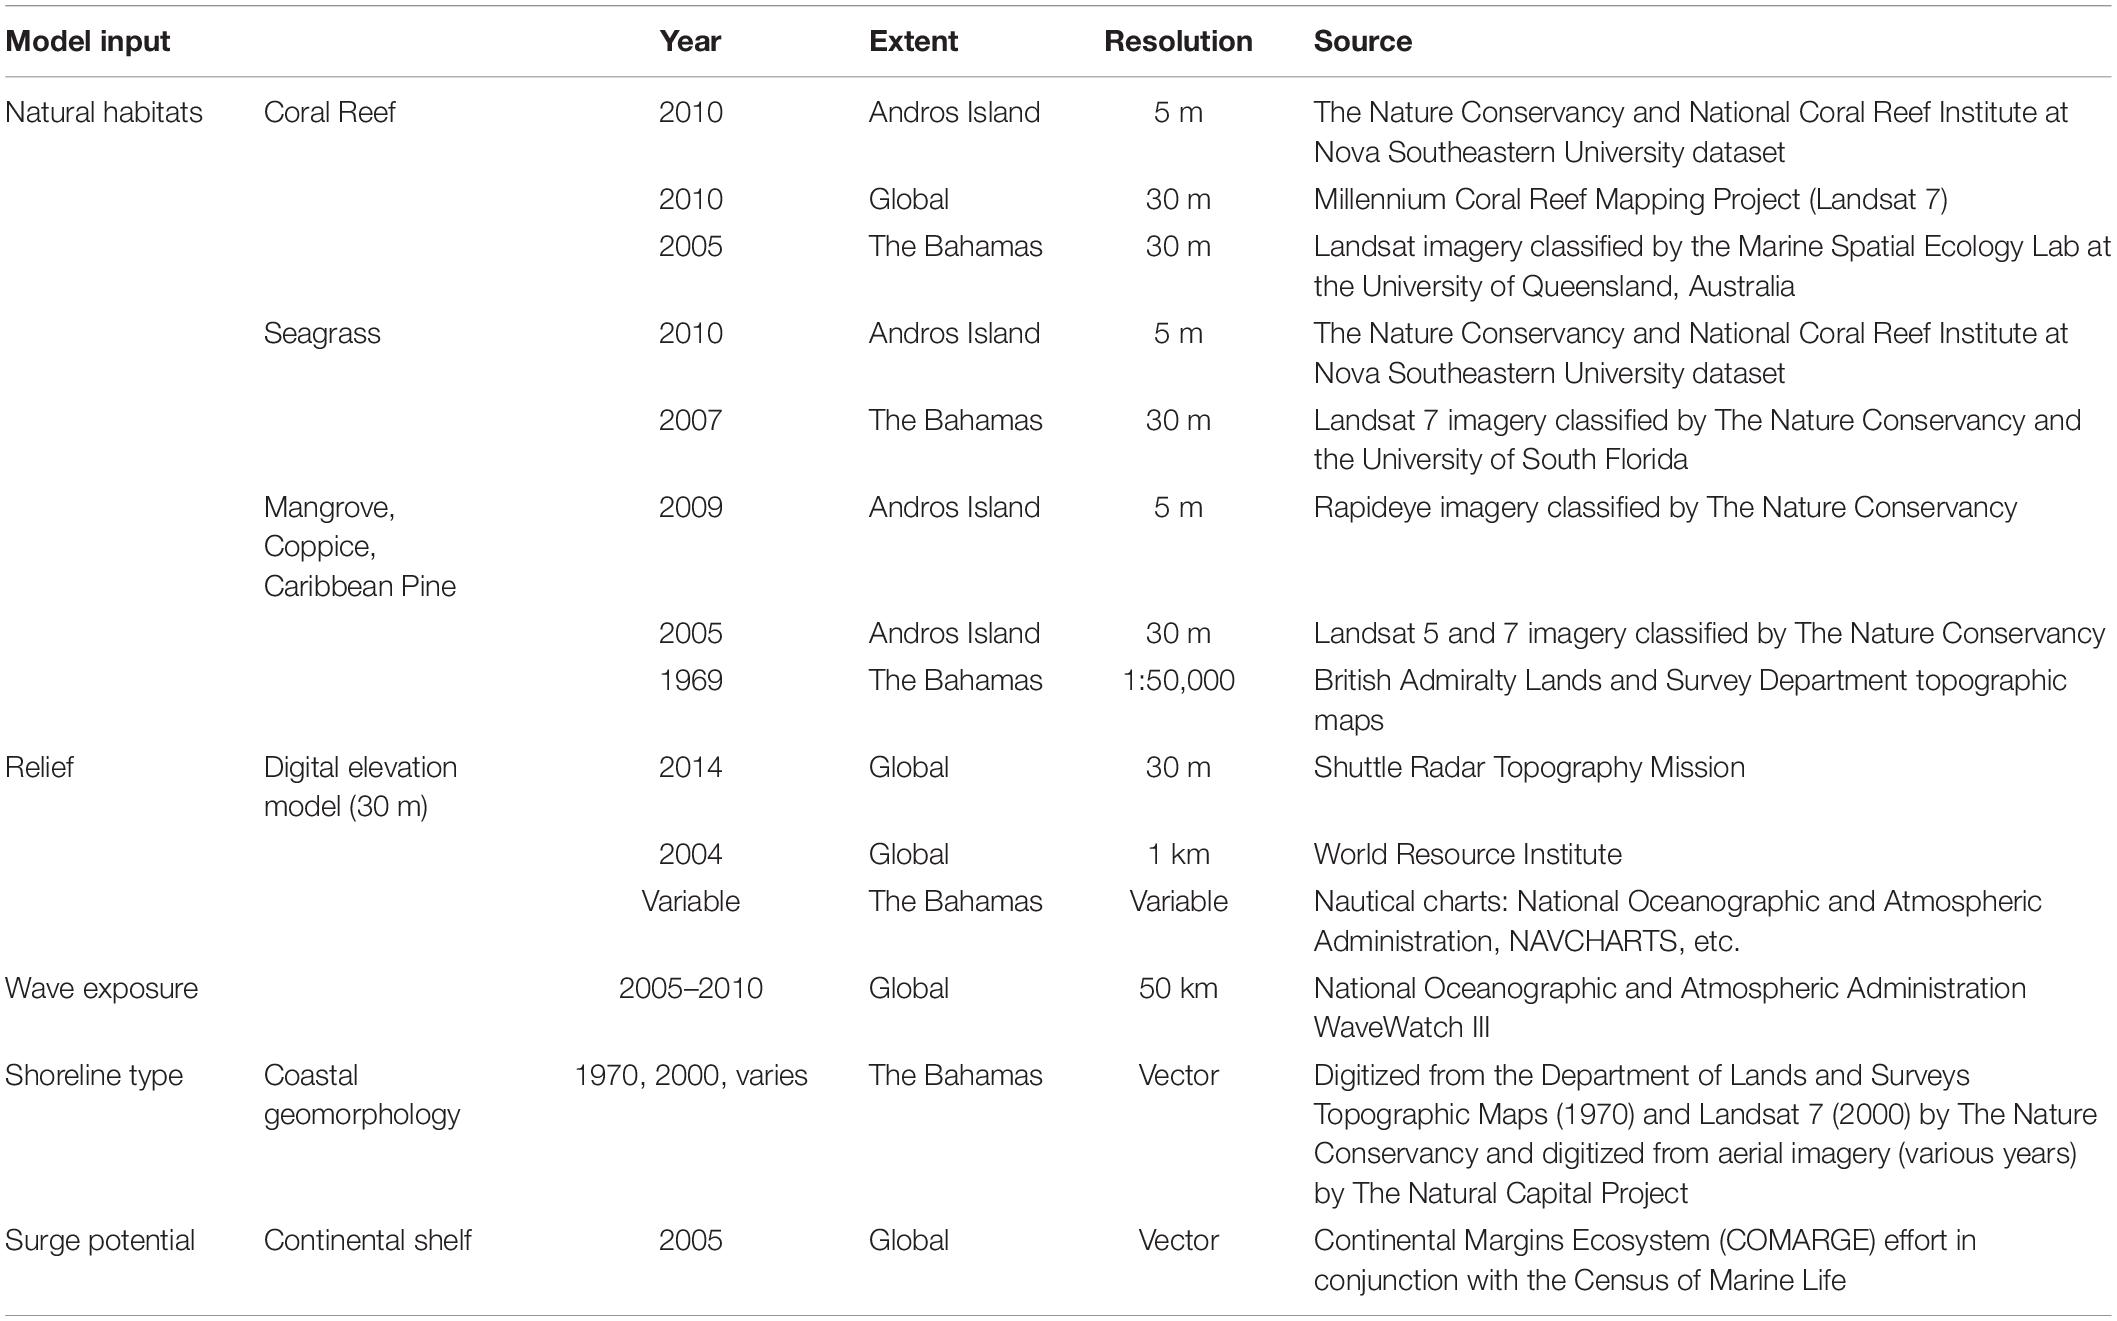
Table 2. Data sources for Coastal Vulnerability model inputs.
To map the distribution of coral reefs we used three sources: (1) the National Coral Reef Institute (NCRI) at Nova Southeastern University Oceanographic Center dataset which covers the barrier reef off the East Coast of Andros Island (The Nature Conservancy [TNC], and The National Coral Reef Institute [NCRI], 2010), (2) the Millennium Coral Reef Mapping Project data covering the rest of The Bahamas (Andréfouët et al., 2006; UNEP-WCMC et al., 2010), and (3) data from the Marine Spatial Ecology Lab at the University of Queensland, Australia (Marine Spatial Ecology Lab [MSEL], 2005). Reef were also filtered by depth such that reef deeper than 20 m were excluded from the analysis. For the expected wave heights, a depth of 20 m was considered as the threshold beyond which the wave-bed interaction was negligible. As a result, it was primarily the reef crest that was included in the analysis, which is thought to provide the majority of reef related coastal protection services (Ferrario et al., 2014). Coral roughness was assumed to be the same across the study area, which did not account for changes in rugosity due to coral composition or degradation.
Seagrass coverage was compiled from different datasets, one for the area around Andros Island (The Nature Conservancy [TNC], and The National Coral Reef Institute [NCRI], 2010) and two for the remainder of the county (The Nature Conservancy [TNC], and The University of South Florida, 2007; Knowles et al., 2017).
To map the distribution of coastal vegetation including mangrove forests, coastal coppice forests and Caribbean Pine forests, we used RapidEye (2009, 5 m) and Landsat 5 and 7 (2005, 30 m) satellite imagery classified by TNC for Andros Island. We also used forest cover digitized from 1969 British Admiralty Lands and Survey Department topographic maps for the remainder of the country. These older maps were manually updated to capture changes in forest cover in the past 50 years discernable from satellite imagery. Mangrove forests were then divided into two categories: (1) tall mangrove and (2) mangrove swash/swamp (characterized by lower canopy heights and more open mudflat between plants). Thus, four types of coastal vegetation were input into the model (Table 1).
All habitat data were converted to Esri shapefiles with linear units in meters (WGS 1984 UTM Zone 18N projection). As described above, country-wide habitat maps combined the best available data, which varied in age and resolution (Moss and Moultrie, 2014; Knowles et al., 2017). Attempts made to update older datasets are described above, and the model can be reapplied as additional and more accurate data become available.
Habitat Ranks and Protective Distances
Each habitat type was assigned a rank based on differences in morphology and expected ability to prevent erosion and attenuate waves and storm surge. A rank of “1” offers the greatest protection, “4” the least, and “5” designates no protection afforded by habitat. We did not include any process-based reduction or attenuation function of waves or surge in the habitat ranking system. Habitat ranks are presented in Table 1 and are based on expert judgment and the peer-reviewed literature (e.g., reviewed in Shepard et al., 2011; Arkema et al., 2013; Spalding et al., 2014; Narayan et al., 2016). A habitat-specific “protective distance” was also defined to indicate the extent of coastline likely receiving protection from a given habitat type. These distances are essentially a technical shortcut, rather than an ecological or hydrodynamic parameter. They allow us to designate which coastline segments are protected by patches of habitats located at different distances from the grid cells, given that the model does not take into account the numerous factors (depth, channel configuration, distance from the coast, etc.) that could influence the distance over which effects of these habitats may be prominent (Arkema et al., 2013; Sharp et al., 2018).
Lastly, we included in the index the protection provided to coastal segments by more than one habitat type (Guannel et al., 2016). For example, some shorelines may have only coral reefs, while other areas are fringed by mangroves and seagrass, as well as corals. The ranks have been assigned in such a way that multiple co-occurring high-ranking habitats (e.g., seagrass and short mangrove) perform better than either one alone, but do not perform as well as a lone low-ranking habitat such as coral reef (Sharp et al., 2018). Our ranking approach is a first attempt to incorporate the role of multiple habitats in reducing coastal vulnerability over such a large geographic scale and is flexible enough to be refined as future research in this field emerges.
Relief
Coastal elevation (i.e., relief) is an important indicator for potential inundation during storm events. To calculate a relief rank, we created a seamless topo-bathy Digital Elevation Model (DEM) from three datasets of varying spatial and temporal resolutions: (1) 30 m globally available SRTM version 3 topography data (NASA LP DAAC, 2014), (2) 1 km bathymetry for The Bahamas from the World Resource Institute (World Resources Institute [WRI], 2004), and (3) digitized nautical chart soundings at different scales from across The Bahamas (NOAA, NAVCHARTS, etc.). For each shoreline segment, elevation (i.e., relief) was averaged within a 2,000 m averaging radius and assigned a relative rank of 1–5 based on the full distribution of values (the model uses percentile breaks 20, 40, 60, and 80 to categorize the distribution by default). The neighborhood mean was selected to capture significant changes in elevation along the shoreline without being influenced by inaccuracies in relatively coarse topographic data inputs (DEM) (Table 2).
Wave Exposure
Waves are an important factor influencing the erosion and flooding of shorelines. The wave exposure was estimated from the average power of the 10% largest waves (in height) encountered in each of the 16 cardinal directions from a given shoreline segment (Sharp et al., 2018). Wave heights were in turn extracted from a globally available dataset; the National Oceanographic and Atmospheric Administration (NOAA) WAVEWATCH III hindcast re-analysis results for an 8-year period (2005–2013) (Tolman, 2009). Wave exposure is calculated differently by the model for oceanic and locally wind-generated waves, as sheltered coastline segments are exposed only to local waves. The final relative ranks of 1–5 are assigned based on the full distribution of wave power values observed in The Bahamas. For example, those shoreline segments with wave power values falling in the 0–20th percentiles (i.e., first quantile) of values relative to all shoreline segments in the country were assigned a rank of “1,” and those with values in the 81–100th percentiles (i.e., fifth quantile) were assigned a rank of “5” (Table 1).
Shoreline Type
Shoreline type describes the composition of the shoreline, which influences susceptibility to erosion. Because the model is a relative ranking model, we sought to capture the dominant shoreline types and highlight differences in their relative susceptibility to erosion. Several datasets were combined to produce a country-wide shoreline type layer. Sandy beaches and rocky shores were digitized by The Nature Conservancy from Department of Lands and Survey Topographic maps (1970) and Landsat 7 imagery (2000) (Knowles et al., 2017). Using the map of mangrove distribution described above, we assumed muddy shorelines where mangrove was dominant. Lastly, we used high-resolution satellite imagery (Google Earth, Microsoft Bing) to fill gaps in the country-wide shoreline type map. Three naturally occurring shoreline types were classified for The Bahamas: sandy beaches were given a rank “5” muddy shorelines (“4”), and rocky shorelines (“3”). Seawalls were given a rank of “2.” Comprehensive data on the location of seawalls were not available country-wide. Major seawalls detectable via satellite imagery were included in the model but many smaller seawalls were not. Furthermore, seawalls often have an edge effect where erosion is amplified around the edges. This can be captured by the model, but we chose not to reflect this in our analysis due to the fact that our seawall coverage was incomplete.
Storm Surge Potential
To estimate surge potential, we calculated the cross-shore distance between each segment of coastline and the edge of the continental shelf. The distance to the shelf is a proxy for storm surge potential based on the well-known fact that a shallow bathymetry promotes the “piling up” of water during storm events, causing the phenomenon of storm surge (Resio and Westerink, 2008). To calculate this proxy, we used a polygon representing the edge of the continental shelf that was prepared by the Continental Margins Ecosystem (COMARGE) effort in conjunction with the Census of Marine Life. Since storm surge is a critical driver of exposure to coastal hazards in The Bahamas, and the above proxy for surge potential may oversimplify the dynamics of the phenomenon, we also had local experts from the Departments of Meteorology and other relevant agencies review the results obtained via this simple approach. Their experiences with areas significantly affected by previous storms supported our results. Finally, we compared the relative risk of exposure to storm surge, as estimated by the proxy discussed above, to values from the Storm Surge Atlas (Rolle, 1990) available for a portion of the Northern and Central Bahamas. The relative relationship of surge potential across the region agreed qualitatively well between our proxy and the modeling from the Storm Surge Atlas for this region.
Habitat and Sea-Level Rise Scenarios
Habitat Scenarios
A primary goal of this analysis was to quantify the role that natural habitats play in reducing risk to people in The Bahamas. To quantify habitat role, we considered two heuristic scenarios, a “with habitat” scenario that accounts for the protection provided by the current distribution of coastal and nearshore habitats throughout the country, and a “without habitat” scenario where habitat is assumed to be lost, and no longer provide protection. The “without habitat” scenario is intended to evaluate where and to what extent habitats are providing protection to people, and is not intended to represent an actual reflection of the future. To represent a “without habitat” scenario in the model, the habitat rank was changed to “5.”
Sea-Level Rise Scenarios
This analysis involved comparing the relative exposure to coastal hazards under current sea levels (2015) against two future SLR scenarios (2040, 2100). We focused primarily on 2040 because this analysis was conducted in the context of a sustainable development planning effort for Andros Island and a national development planning process (Vision 2040) which both had time horizons of 25 years. No local tide gauge data were available to produce spatially explicit rates of SLR within the country. Instead, we looked at the relative change between current and future scenarios assuming uniform rates of SLR across the entirety of The Bahamas. We estimated the relative change in sea-level between timesteps using the projected SLR curve for the highest RCP scenario (2 m rise by 2100) depicted in Figure ES 1 of Parris et al. (2012). To do this we divided the net rise (cm) from the start of the curve (1992) to the end (2100) into quantiles as follows: 0–40 cm rise corresponded to a rank of “1,” 41–80 cm “2,” 81–120 cm “3,” 121–160 cm “4,” and 161–200 cm a rank of “5.” Using the curve, we estimated the net rise at the current timestep (2015) within the first quantile (∼10 cm) and assigned a rank of “1.” The projected rise for 2040 (our planning horizon) was ∼40 cm and was assigned a rank of “2” (Table 1). This is a simple approach to reflect the increased exposure to coastal hazards anticipated as sea-levels rise.
While we were primarily concerned with understanding changes in risk associated with the near-term SLR scenario (2040) which aligned with the planning process, we also considered a longer-term scenario (2100). According to the same approach we used for the current and 2040 scenarios, the projected net rise for 2100 was 2.0 m (Parris et al., 2012) and was assigned a rank of “5.” This represents a more extreme increase in sea-levels expected over longer timelines (i.e., 2100) to further investigate the influence of SLR as driver of risk.
Mapping Coastal Communities
To relate hazard to people at risk, first we mapped demographic variables for the country including total population (people/500 m2), elderly people (>65 years old) and young people (<15 years of age) (per 500 m2). We classified young people as <15 years of age, which is older than the cutoff of <5 generally cited in the social vulnerability literature. We used the higher age cutoff to capture demographic patterns even in more sparsely populated parts of the country. Demographic data collected during the 2010 Bahamian Census at the supervisory district level, obtained from the Department of Statistics, was distributed spatially using the globally available Nighttime Lights Time Series (National Oceanic and Atmospheric Administration [NOAA], 2011). Light intensity (a proxy for population density) was extracted from all supervisory districts in The Bahamas from NOAA’s Nighttime Lights Times Series. For each supervisory district a “demographic metric per unit of light intensity (DM/LI)” was calculated by dividing the demographic variables for that supervisory district by the summed light intensity for that district. The DM/LI ratio was then multiplied by the entire nighttime lights raster for that supervisory district to distribute the demographic variable across the district. This methodology allows the demographic variables to be mapped at a finer resolution by using the relative weighting of the light intensity (Nicholls et al., 2008; Henderson et al., 2011).
Quantifying Risk to People
To assess the vulnerability of people (total population, elderly and young people) in The Bahamas to coastal hazards, we analyzed the overlap between the coastal segments with the highest exposure to coastal hazards and the metrics described above. To do this we estimated the total number of people, number of elderly and young individuals living within 1 km of the coast for each 250 m2 shoreline segment from the coastal hazard index (after Arkema et al., 2013). No estimates of expected population growth were used in this study, so the values represent current (2010) population only.
Results
In the sections that follow we start with a review of key findings at the national-scale and then focus more in depth on island-scale results. In particular we report on the spatial distribution of risk, the drivers of risk, and the potential for coastal and nearshore ecosystems to provide protection to people now and with future SLR. In the discussion we describe how these results were used in a number of different decision-making processes in The Bahamas.
National-Scale
Spatial Distribution of Risk
Modeled results indicate that nearly one fifth of the coastline and nearly two in ten Bahamians are currently at highest risk of exposure to coastal hazards (Figures 2A,B). With modeled SLR, we found that the extent of shoreline most exposed to coastal hazards would more than double, and the total population would nearly triple (with more than 10% of the population, >40,000 people, living in highest risk areas) (Figure 2B). Modeled estimates of population assume a constant 2010 population as no projections were available for 2040, but given that population is increasing in The Bahamas these results likely underestimate future risk.
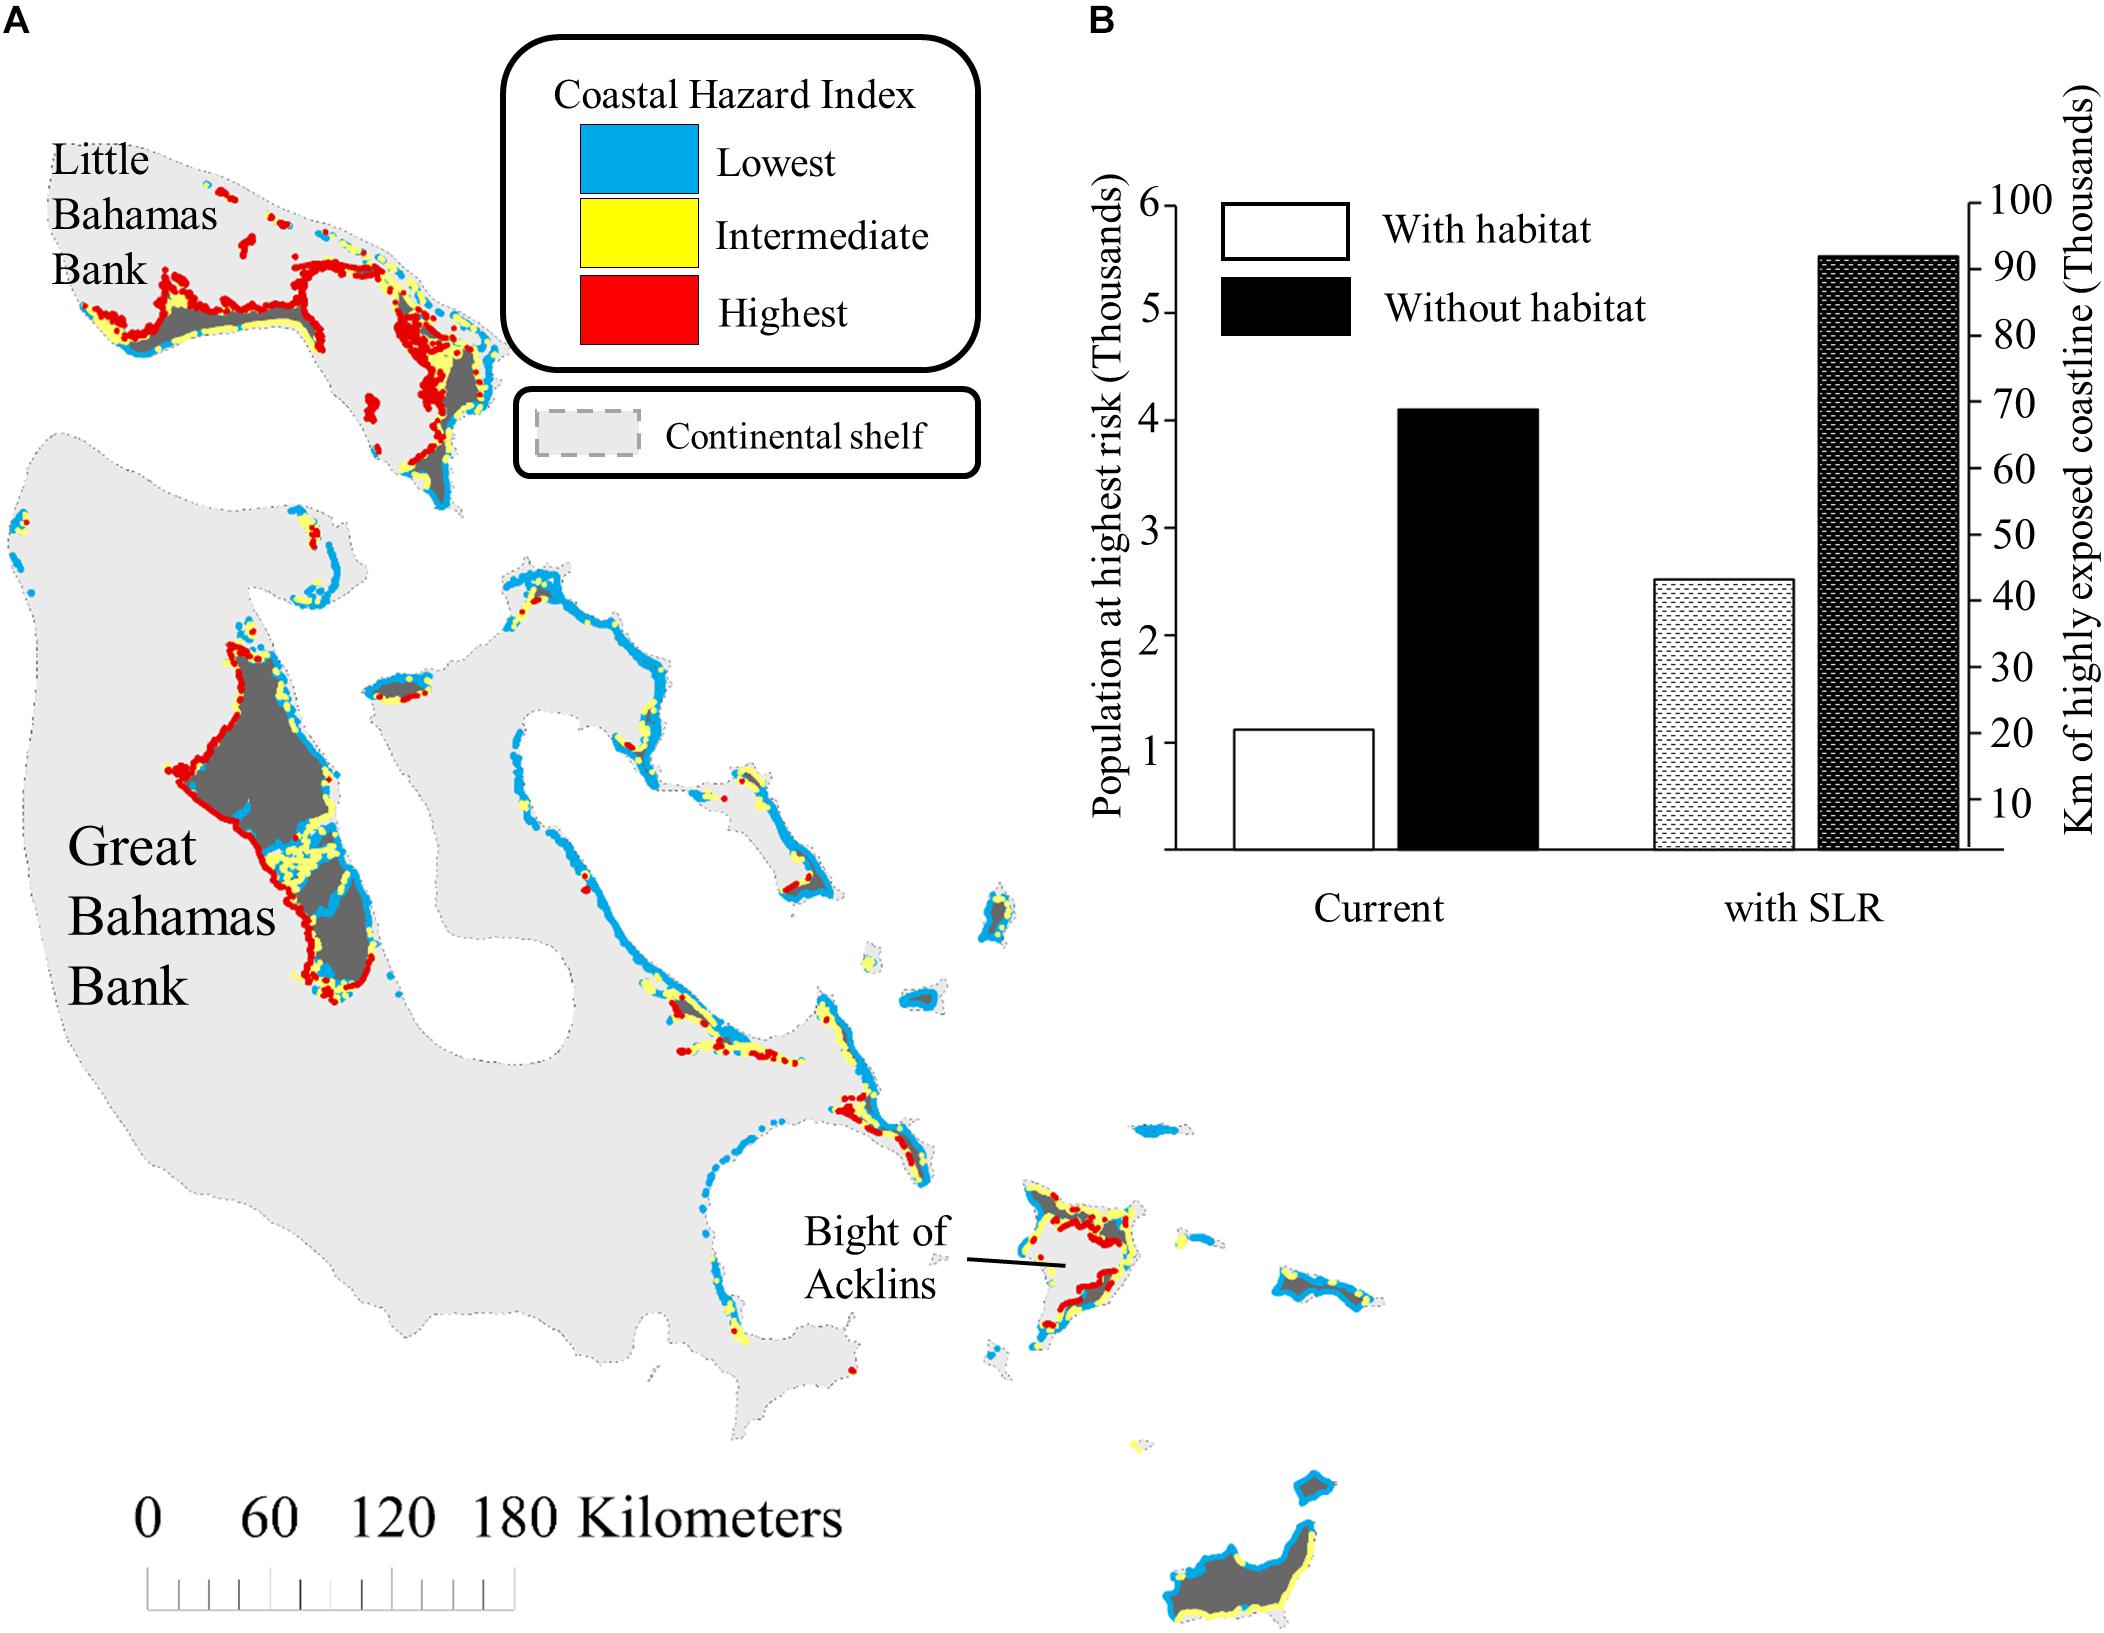
Figure 2. (A) Relative exposure to coastal hazards for The Bahamas. Storm surge is a key driver of exposure for The Bahamas and this is reflected in the modeled results. The greater the distance from land to the edge of the continental shelf (in gray), the greater the potential for exposure to storm surge. (B) Length of highly exposed coastline and number of people at the highest risk with and without coastal and nearshore habitats, currently and with future SLR. Results are represented using the same set of bars for both metrics because at the national scale these variables are highly correlated.
Coastal Protection Provided by Ecosystems
Coastal and nearshore ecosystems occur along almost the entire coastline of The Bahamas, often with multiple habitats fronting sections of shoreline (e.g., coral reef backed by seagrass and mangrove) (Figure 1A). Our results suggest that if these habitats are lost, even under current sea-levels, the length of shoreline highly exposed to hazard throughout the country would quadruple (Figure 2B). With habitat loss and modeled SLR, the length of shoreline at highest exposure increases fivefold (Figure 2B), putting an estimated quarter of the population at highest risk. These results highlight the important role ecosystems may be playing in providing coastal protection now and in the future.
Island-Scale
Distribution and Drivers of Coastal Hazard
We found the most exposed coastline in The Bahamas located predominantly along the side of islands that sit on extensive shallow banks, where the potential for significant storm surge is high (Figures 2A, 3). Notable examples included the north coast of Grand Bahama and west coast of Abaco, which sit on the Little Bahamas Bank, the west coast of Andros Island, located on the Great Bahama Bank, and the western coast of Acklins and Crooked Islands, situated on a large shallow lagoon called the Bight of Acklins (Figure 2A). Modeled results indicate that, relative to the rest of the country, these four islands have the greatest proportion of highest hazard shoreline (Figures 4, 5). New Providence Island, the most densely populated in the country and the seat of the capitol city Nassau, is the next most exposed island in The Bahamas, with nearly a tenth of its total shoreline currently highly exposed. As with the previous examples, the most exposed areas on New Providence are primarily along the southern coast of the island where it is positioned on a shallow tongue of the Great Bahama Bank. Our modeling suggests that, in addition to surge potential, low elevations and soft, erodible sediments are key factors driving risk on islands with large proportions of exposed shoreline (Figure 3).
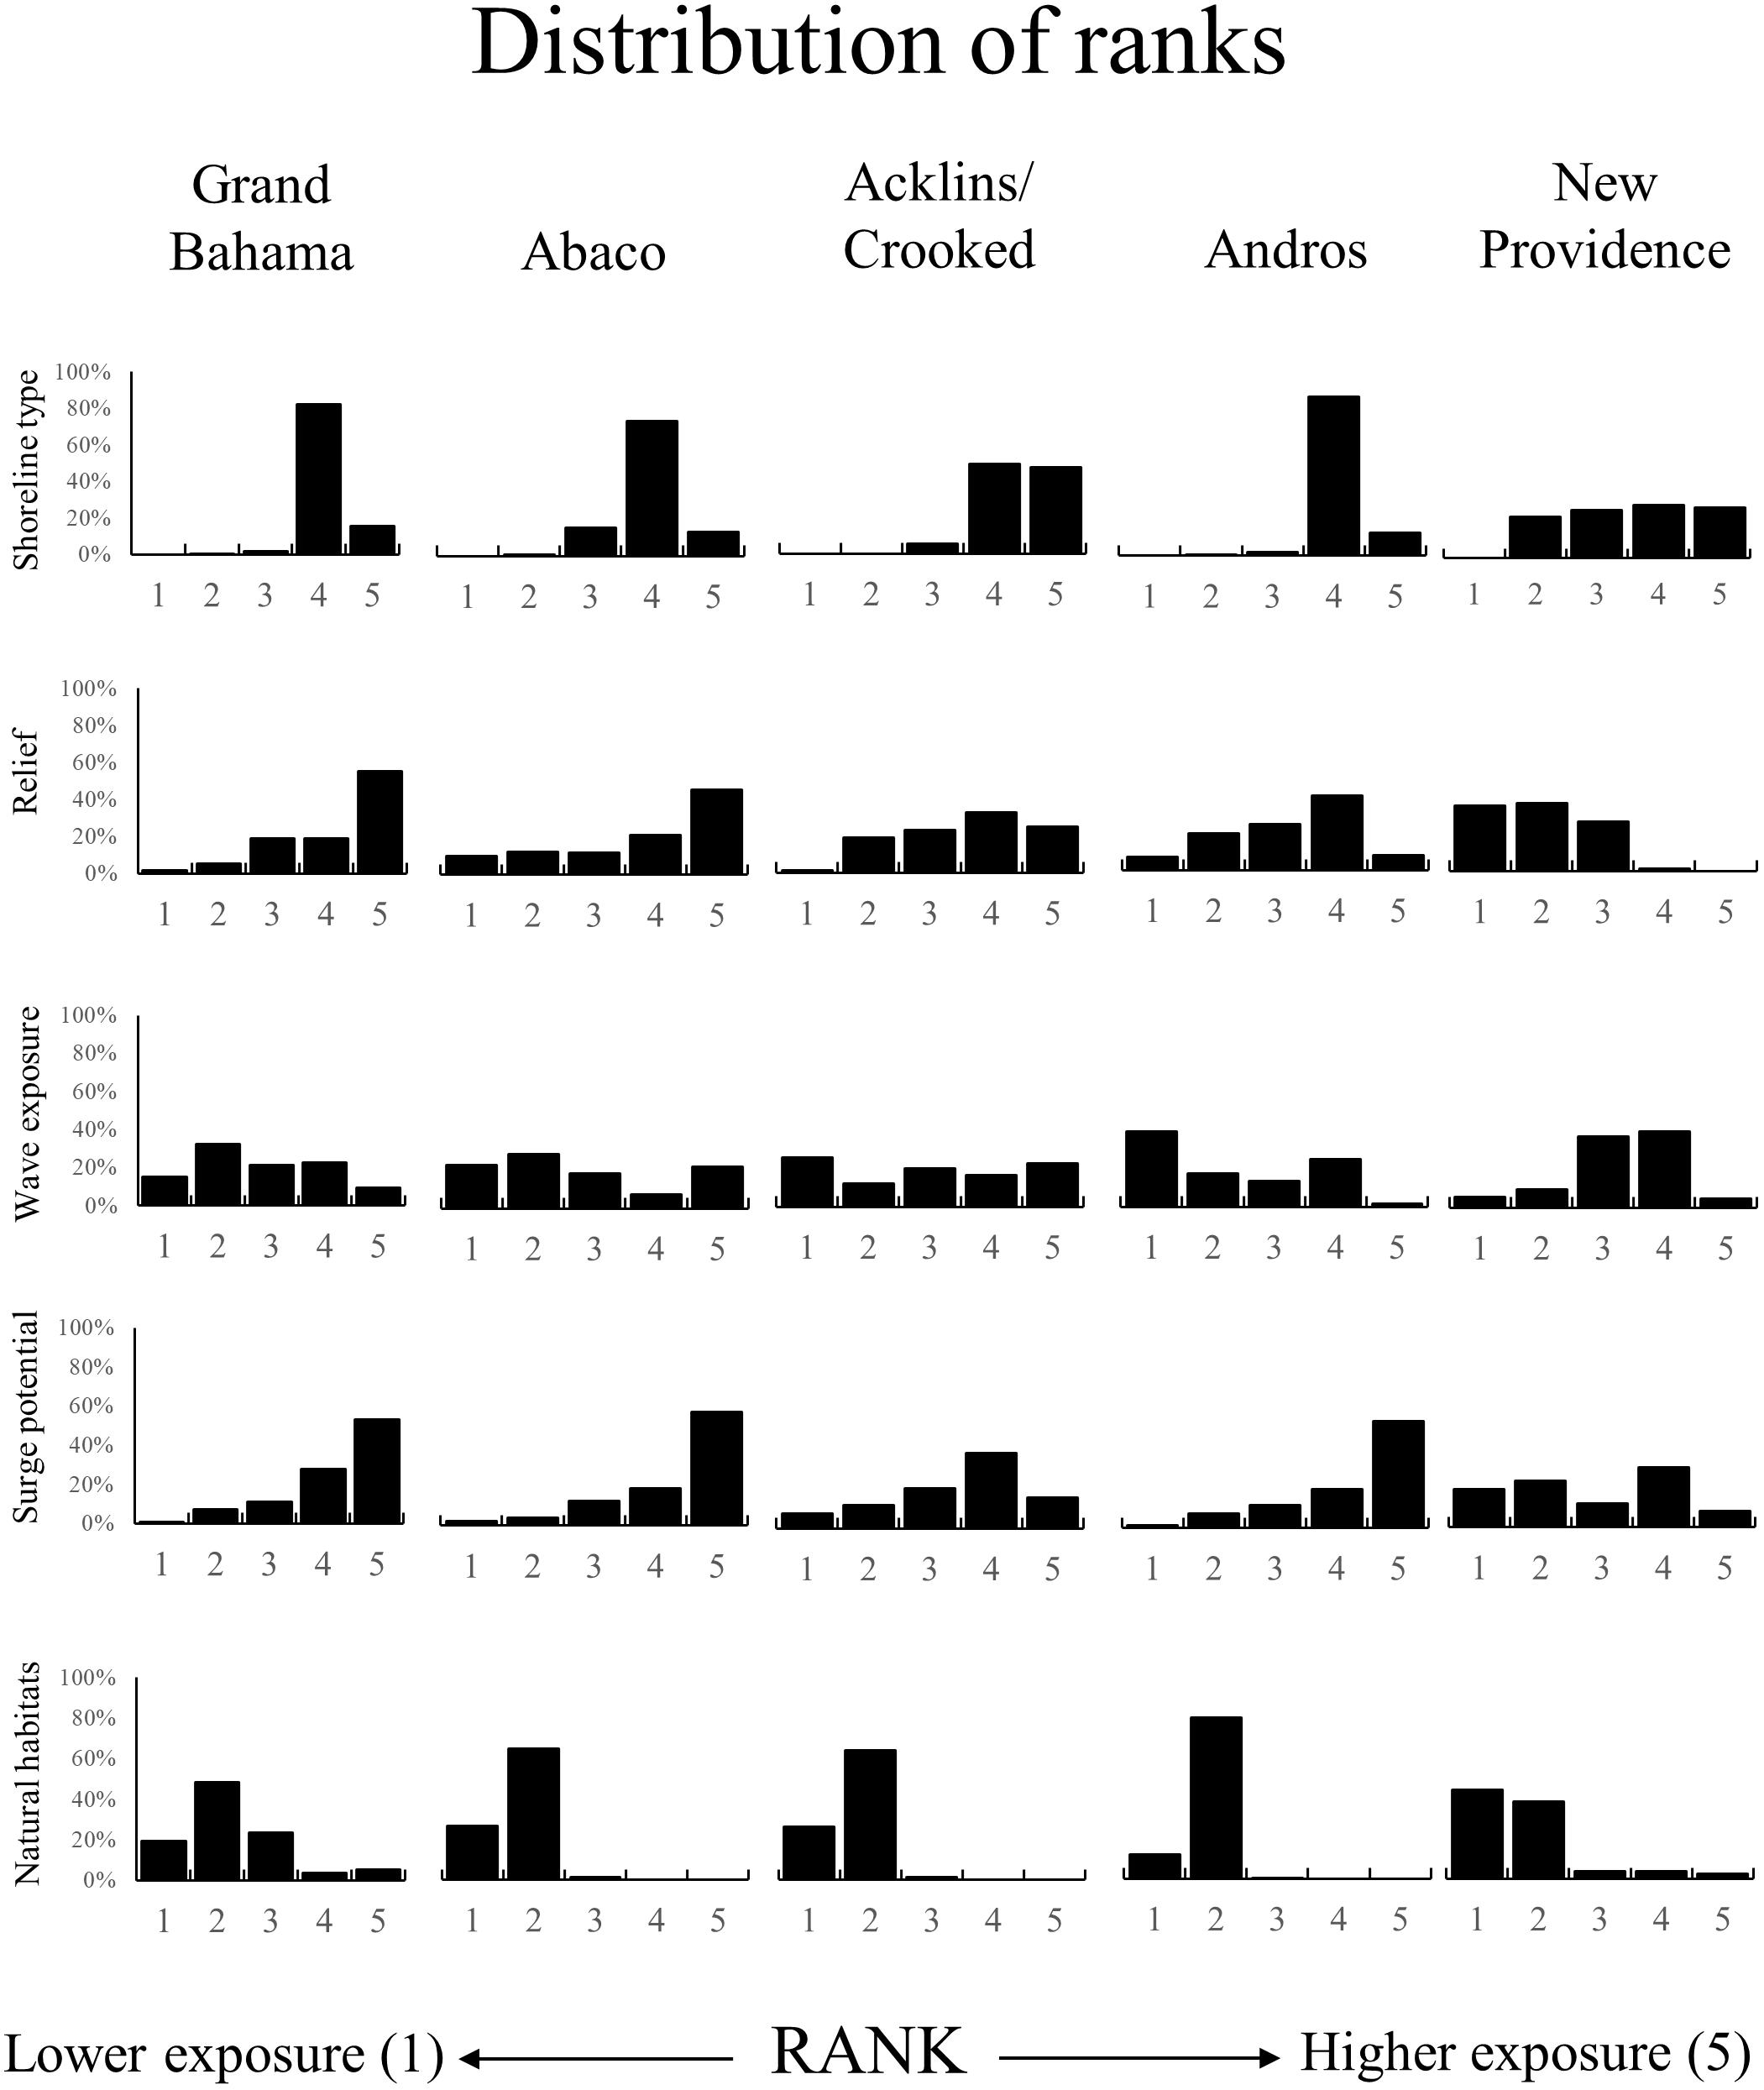
Figure 3. Distribution of ranks for individual variables in the coastal hazard index for each 250 m coastal segment for the islands in The Bahamas with the greatest proportion of highly exposed coastline. A rank of “1” contributes to lowest exposure, while a rank of “5” contributes to highest exposure. These distributions of ranks for individual variables in the coastal hazard index reveal key drivers of exposure across the region. For example, wave exposure ranks are distributed relatively uniformly (from 1 to 5) across each island indicating that this variable may be less critical in influencing differences in exposure among these five islands. However, the shoreline type and surge potential variables are skewed toward higher ranks, indicating that these are important variables driving the relatively high exposure on these islands.
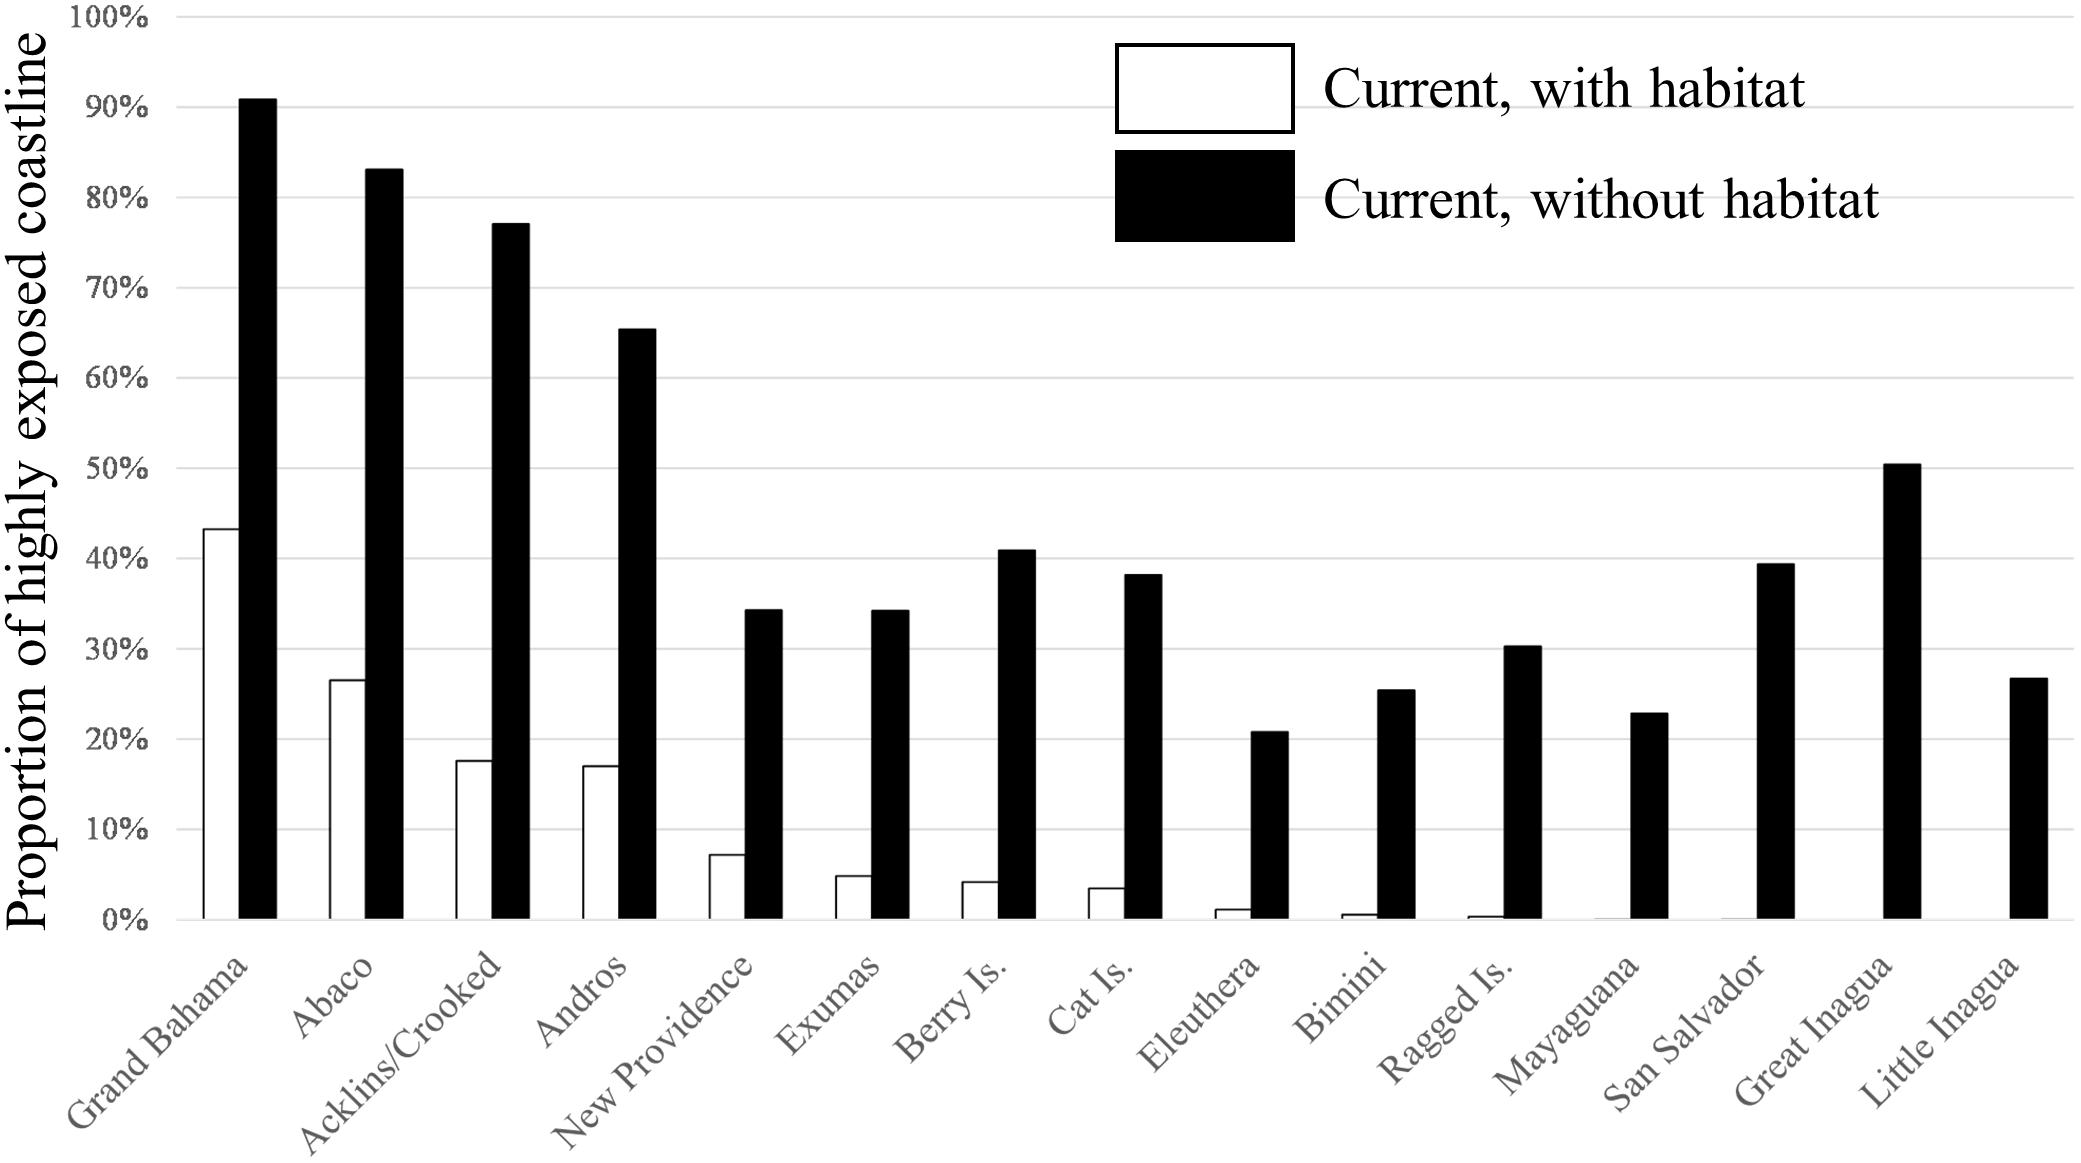
Figure 4. Percentage of highly exposed coastline for each major island in The Bahamas, with and without coastal and marine ecosystems. This is for the current scenario, not accounting for SLR.
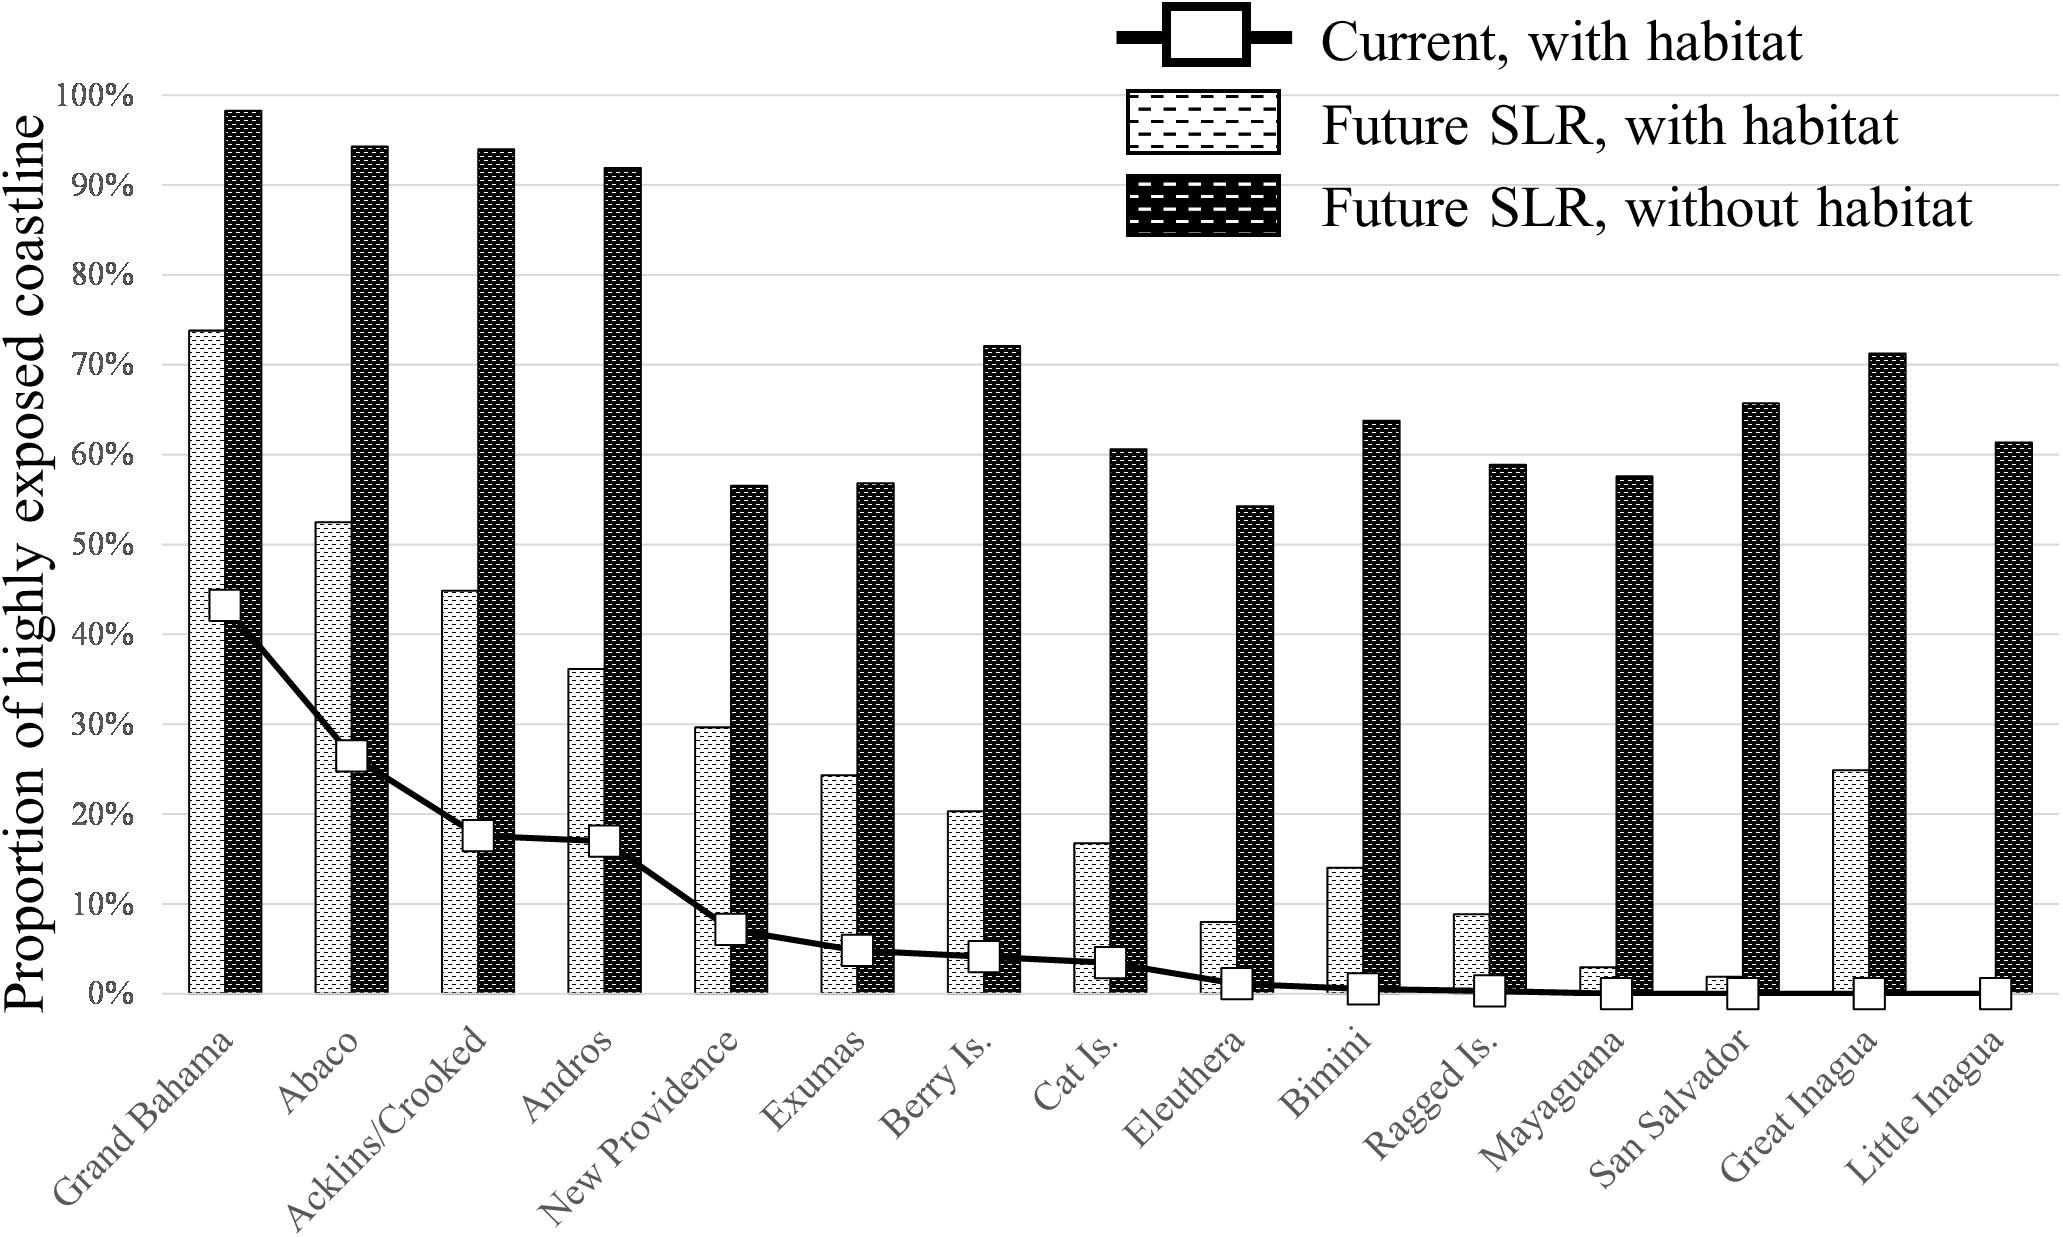
Figure 5. Percentage of highly exposed coastline for each major island in The Bahamas, with and without coastal and marine ecosystems, currently and with future SLR.
Shoreline of other islands, such as Great and Little Inagua, Mayaguana, San Salvador, and the Ragged Island chain, are relatively less exposed, compared to the rest of the country (Figures 2A, 4, 5). On these islands, we found that exposure is mitigated by relatively higher elevations, lower potential for exposure to storm surge, and in some cases rocky shorelines less prone to erosion. In addition, the presence of coastal and nearshore habitats is vital for protecting these islands. For example, our results indicate that the relatively low exposure of San Salvador and Great Inagua Islands is attributable in large part to attenuation of waves by coastal habitats. If these habitats were lost, nearly half of the coastline of these islands would be classified as highest exposure areas (Figure 4).
Coastal Protection Provided by Ecosystems
Modeled results showed that coastal and marine ecosystems are crucially important for reducing exposure to coastal hazards for every island in The Bahamas. We found that ecosystems provide coastal protection for islands where exposure is inherently high due to other factors (elevation, storm surge potential, etc.), and are equally important for maintaining low exposure of other islands. For example, Grand Bahama Island has the greatest extent of highly exposed shoreline of any island in The Bahamas (almost half of the island is at highest risk). However, Grand Bahama also benefits from coastal protection along >300 km of the island’s coastline by extensive seagrass beds, coral reef, mangrove, and coastal coppice forests (Figures 4, 6). Our results suggest that if these habitats are lost, almost the entirety of Grand Bahama would be highly exposed relative to the rest of the country (Figure 4). In contrast, the shorelines of Great Inagua Island are less exposed to coastal hazard, due in part to higher elevations and lower storm surge potential relative to the rest of the country. But ecosystems, including a fringing reef encircling the island and mangrove forests (Figure 1A), are also critical in protecting the island. We found that, like Grand Bahama, the loss of habitats would result in a 50% increase in exposure for Great Inagua Island (Figure 4).
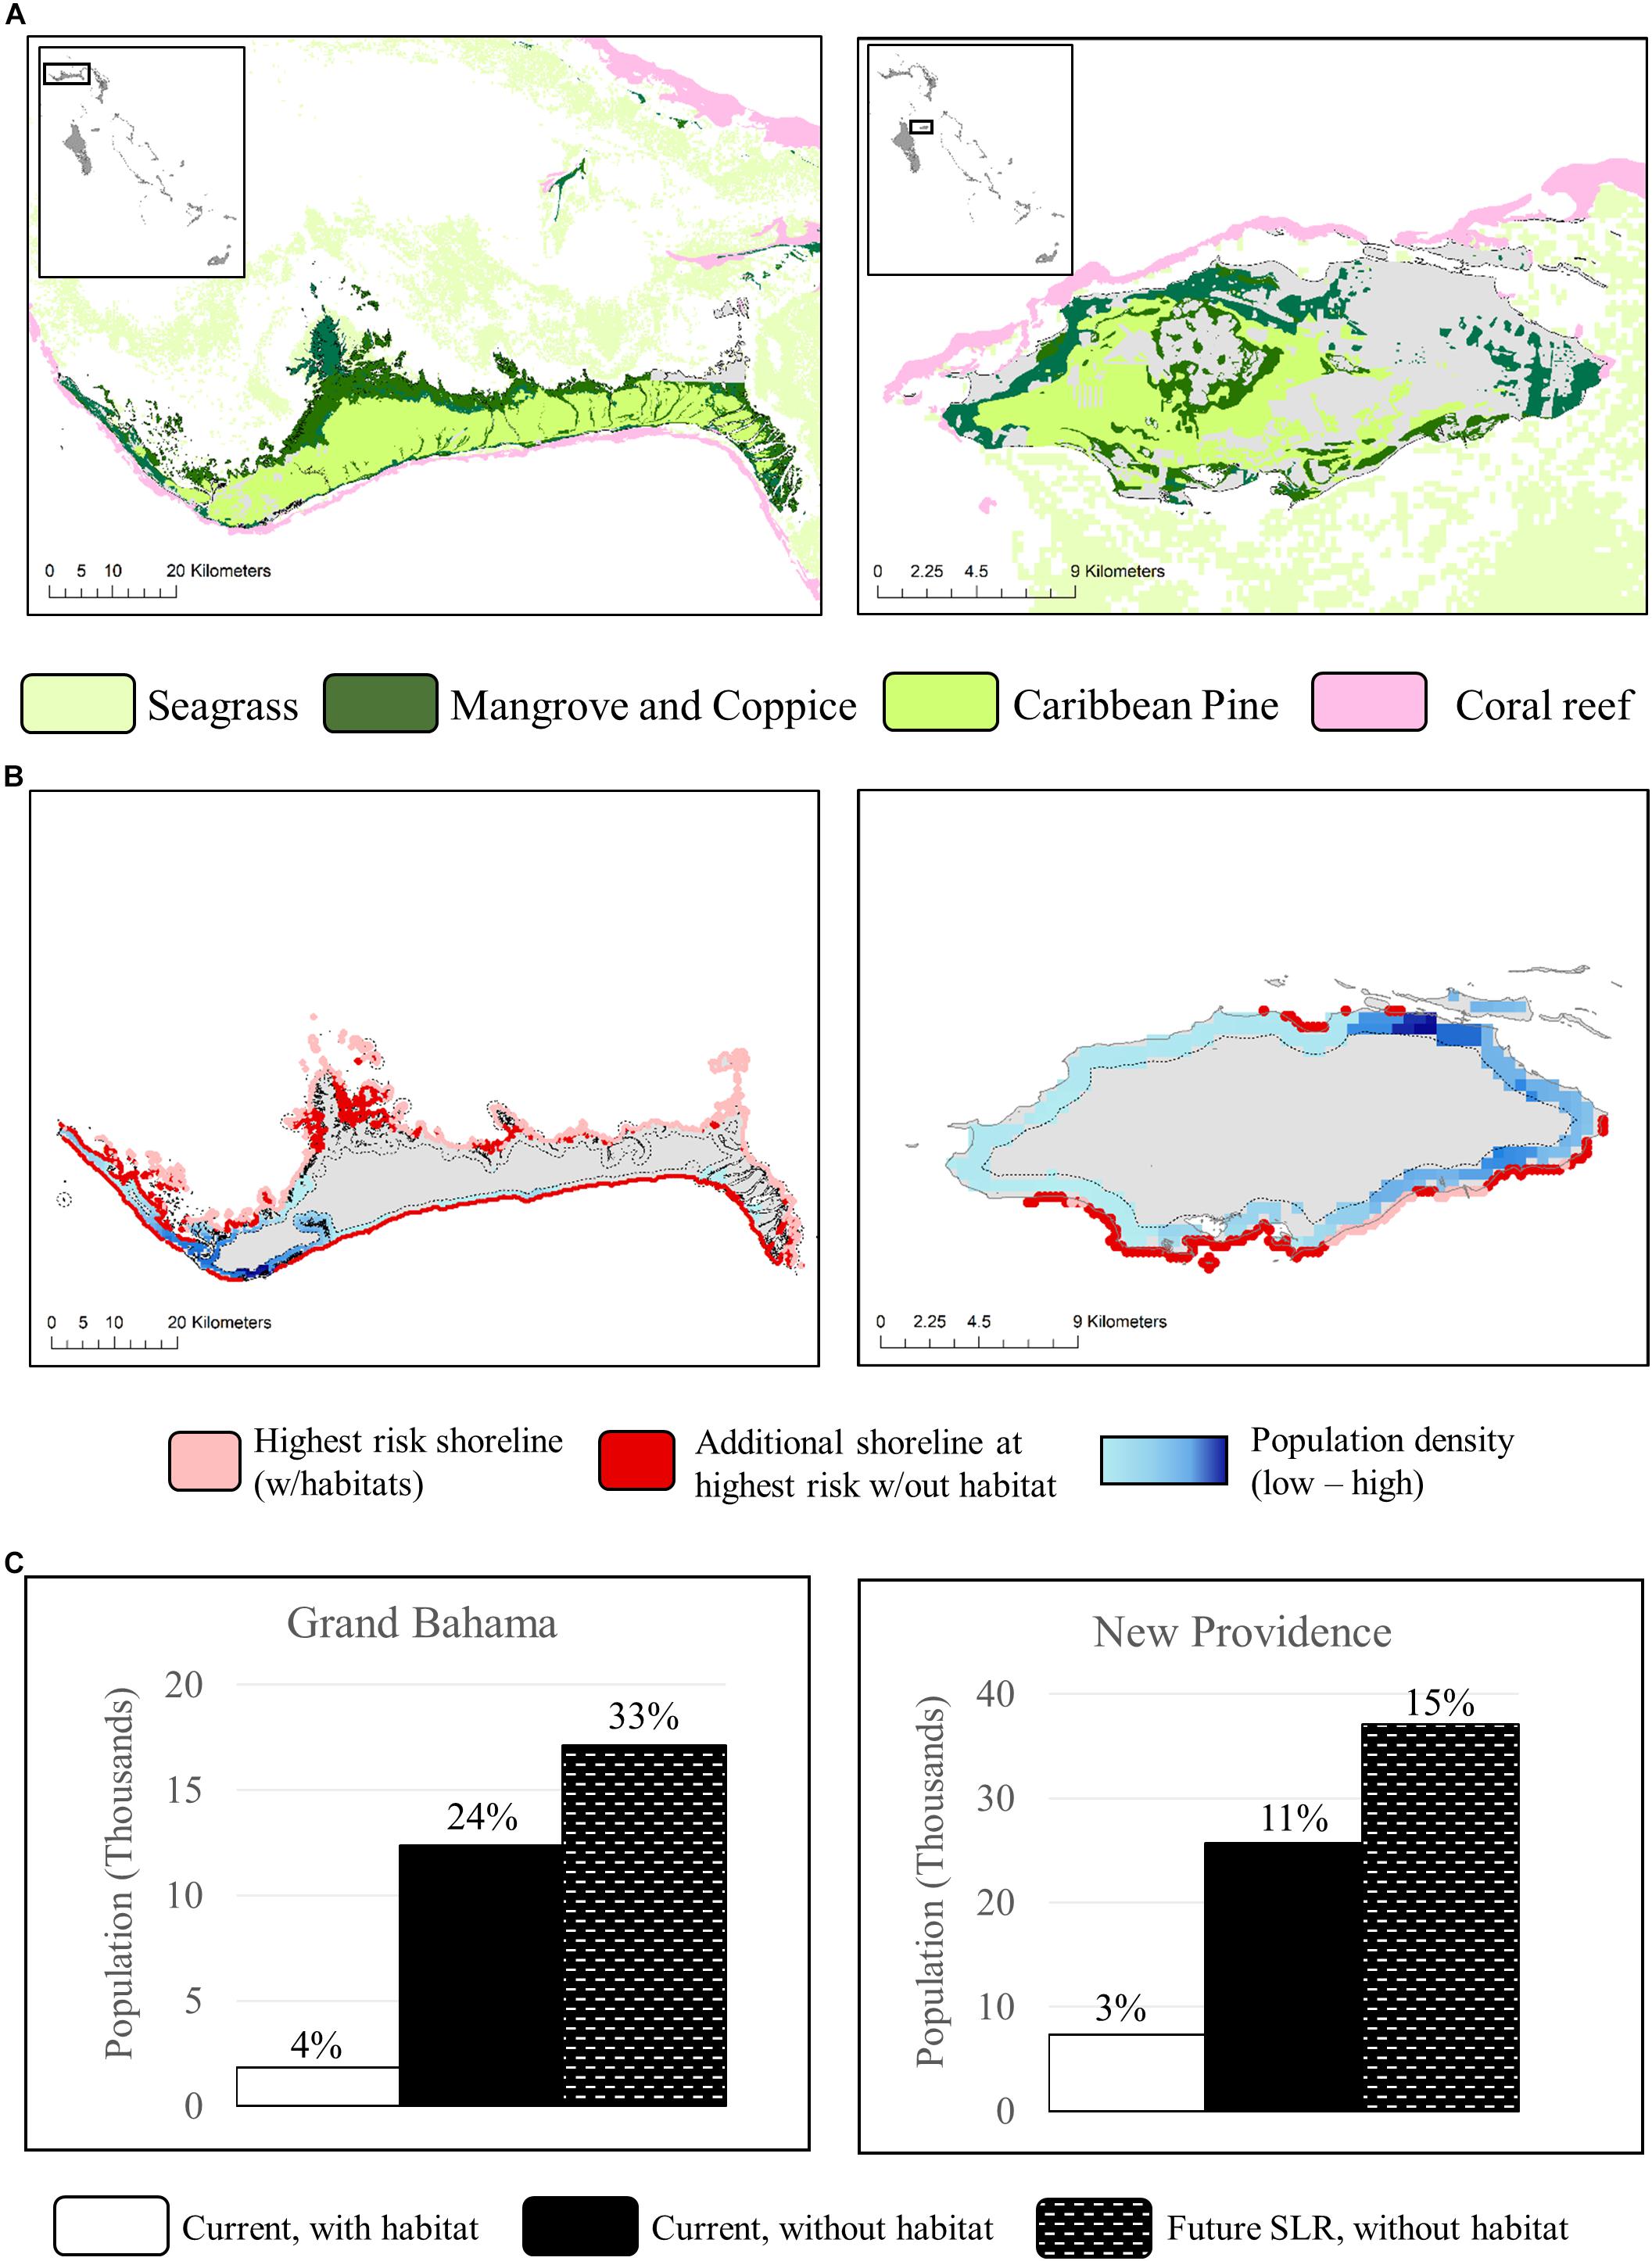
Figure 6. Coastal and marine ecosystems on Grand Bahama and New Providence Islands (A) provide protection for people who, if those habitats were lost, would be living along the highest risk shoreline (B). Population within a 1km inland coastal hazard zone is indicated with a dashed line. Bar charts in (C) show the total number of people and the percentage of the total island population at highest risk in each scenario (with habitat and current sea-levels, without habitat and current sea-levels, and without habitat and SLR).
Future Scenario (SLR)
This analysis also highlights the potential for ecosystems to play a role in mitigating increased exposure to coastal hazard due to SLR across The Bahamas. While modeled SLR indicates an increase in exposure to every island in The Bahamas, our results suggested that the presence of marine and coastal ecosystems can reduce the extent of highest exposed shoreline significantly for all islands, by up to two-thirds, island dependent (Figure 4). For example, the proportion of highly exposed coastline along Grand Bahama increases by about a third in the SLR scenario, and if compounded by habitat loss, almost the entire island is highly exposed. In contrast, if habitats are kept intact, only three-quarters of the shoreline is at highly exposed under future conditions (Figure 5). The difference in exposure with and without habitats suggests that the presence of habitats can reduce the potential increases in exposure to hazards associated with SLR on the island of Grand Bahama by 20% or more (Figure 5). While these estimates are relative and reflect modeling assumptions and simplifications, they hold true for all islands in the country (to varying degrees), and thus suggest a crucial role for habitats in mitigating future hazards.
When a more extreme SLR scenario was considered (e.g., year 2100), we found that the qualitative outcomes remained the same: risk increases with SLR and loss of habitat, but the magnitude of risk increases substantially more with greater SLR. We also found that under a more extreme SLR scenario, the potential for habitats to provide protection is reduced. Country-wide, our results suggests that coastal protection provided by habitats reduces the extent of shoreline (and number of people) at high risk by over half under the moderate SLR scenario (2040) (Figure 2B), and by a third in the more extreme SLR scenario (2100).
Coastal Protection Provided by Ecosystems to People
We found that coastal ecosystems currently provide protection for nearly fifteen percent of Bahamians who, if these habitats are lost, will be at the highest risk of exposure to coastal hazards. For all the main inhabited islands of The Bahamas, the fraction of the population at highest risk doubles, and in many cases triples or increases by an order of magnitude if coastal habitats are lost.
Modeled results suggest that on some islands large numbers of people benefit from the coastal protection provided by ecosystems. For example, only an estimated 4% of the population of Grand Bahama Island is currently living in highest risk areas, but if habitats are lost near a quarter of the island’s population will be at highest risk (Figure 6). Similarly, on Exuma Island only an estimated 2% of the population is currently living in highest risk areas, but this increases to over one third if habitats are lost. On other islands, the loss of habitats results in dramatic increases in risk for an already disproportionately high risk population. For example, on Abaco Island a quarter of the population currently lives in highest risk areas, but if ecosystems are lost, nearly the entire island will be at highest risk. On New Providence Island, habitats provide protection to some of the most densely populated shoreline in The Bahamas. Our results indicate that roughly a tenth of the island’s population is living in an area that may become highest risk if existing habitats are lost. This corresponds to an estimated 18,000 people on New Providence alone that are benefiting from risk reduction provided by coastal and marine habitats (Figure 6).
Furthermore, our analysis highlights where ecosystems are providing protection to socially vulnerable populations. Nationally, roughly one third of the 2010 population in The Bahamas is under 15 years of age, and almost a tenth is elderly (>65). The three most populated islands in the country (New Providence, Grand Bahama, and Abaco) reflect the national average (Figure 7). However, the fraction of elderly is double (or more) on many other islands, and generally increases in the more remote and sparsely populated southern and central islands. Acklins/Crooked and Andros Islands have the highest proportions of both elderly and young people, relative to the other islands in the country (Figure 7). These islands also have large extents of highest risk shoreline. And the proportion of high risk shoreline increases significantly with habitat loss (Figures 4, 5, 7).
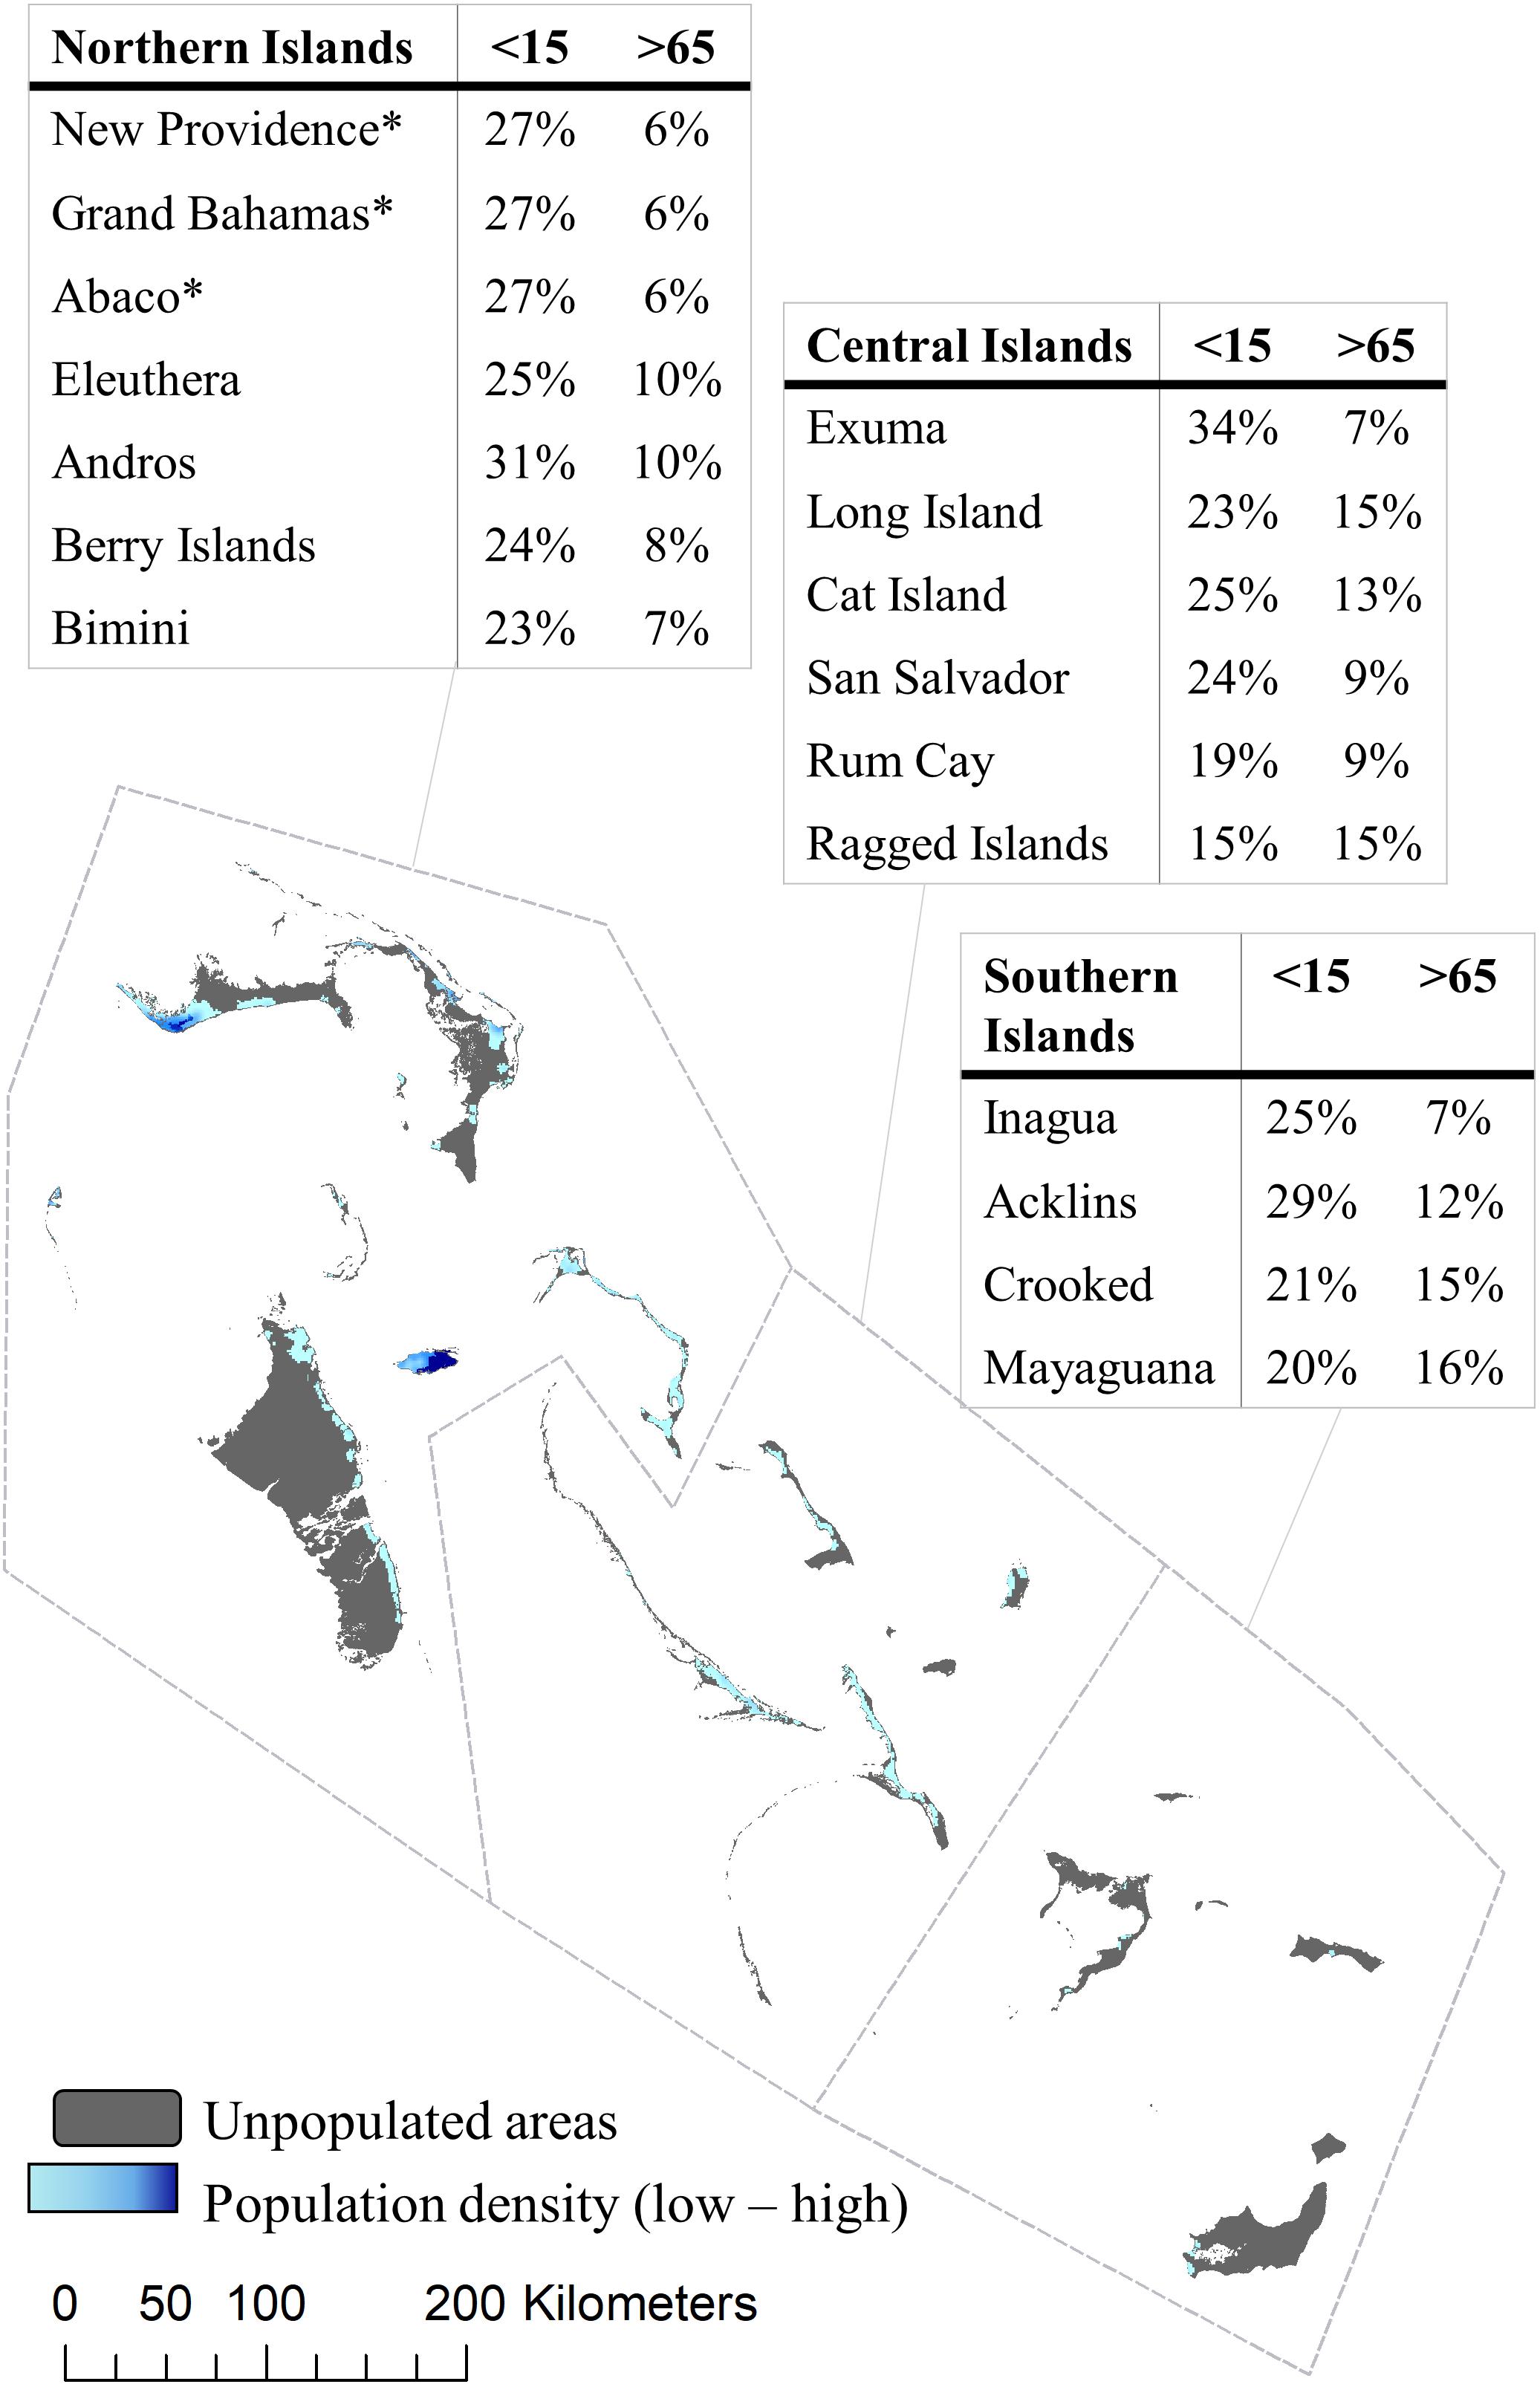
Figure 7. Total population for The Bahamas, as well as elderly and young populations, were mapped using the Nighttime Lights Series (NOAA) for the 2010 population census.
Discussion
The number of studies exploring the coastal protection benefits of ecosystems has grown tremendously in recent years (e.g., Arkema et al., 2013; Ferrario et al., 2014; Spalding et al., 2014; Narayan et al., 2016; Beck et al., 2018). There are, however, few examples of where risk reduction provided by habitats is linked with the socially vulnerable communities that stand to benefit the most, and even fewer examples of where such socio-ecological science has led to on-the-ground investments in conservation or restoration of ecosystems for risk reduction. In a world with rising sea-levels, growing coastal populations, and coastal development threatening coastal ecosystems, innovative approaches are needed that center nature-based protection in a broader socio-ecological framework and provide accessible and transparent tools for decision-makers to explore alternatives. Here we present a modeling approach that allows for assessment of where coastal ecosystems matter most for people now and under future SLR scenarios, and apply it on a timeline to inform coastal management decisions. Modeled results suggest that the magnitude of risk reduction provided by habitats now and under future SLR is substantial. Additionally, our results highlight specific places where such ecosystem-based risk reduction is especially important. Thus, maintaining existing coastal and marine habitat distribution and avoiding future habitat degradation could be among the most effective public policy decisions, both for disaster risk management and climate change adaptation.
The significant contribution ecosystems can have to risk reduction has been shown in previous studies (Alongi, 2008; Barbier et al., 2008; Costanza et al., 2008; Zhang et al., 2012; Arkema et al., 2013; Ferrario et al., 2014; Spalding et al., 2014; Narayan et al., 2016; Beck et al., 2018; Reguero et al., 2018b). Similarly, in this study, we estimated that coastal habitats reduce, by more than half, the extent of shoreline and number of people at highest risk to coastal hazards in The Bahamas under a future SLR scenario. However, the ability of habitats to provide coastal protection depends on their morphological characteristics, distribution, and condition, as well as the forcing conditions they are subject to, all of which make it difficult to generalize where and when natural features will protect people and property (Costanza et al., 2008; Ruckelshaus et al., 2016; Arkema K. K. et al., 2017). We advance the findings from previous studies with methods and approaches to map spatial variation in risk reduction in order to inform spatial planning and decision-making. We identify low-lying locations with highly erodible substrates and multiple habitats as being especially important places to prioritize for conservation in order to maintain coastal protection benefits into the future, especially with sea-level rise. By highlighting the conditions under which ecosystems may be most crucial for coastal resilience, our study can help support more widespread understanding and implementation of nature-based infrastructure in The Bahamas and other countries.
While understanding the physical and ecological factors that enable ecosystems to reduce impacts from coastal hazards is important, a central part of quantifying coastal protection provided by habitats is determining where people stand to benefit the most. Frequently the coastal protection literature tends to focus on the biophysical factors that contribute to risk reduction provided by ecosystems rather than the societal benefits (Arkema K. K. et al., 2017). The results of this study address this gap by synthesizing hazard models, climate scenarios, demographic information and ecological data. Importantly, we identified those locations where the most socially vulnerable populations co-occur with ecosystems that reduce risk, such as elderly populations on remote islands. Age (both elderly and young) is one of the strongest indicators of social vulnerability to coastal hazards both in terms of mortality during storm events and post-disaster recovery, a metric which holds true for resourced and poor nations alike (Cutter et al., 2003; Boruff et al., 2005; Peacock et al., 2012; Arkema K. K. et al., 2017). For example, nearly 60% of the fatalities that occurred in Louisiana during Hurricane Katrina were among the elderly. And mortality increased with age during Hurricane Sandy, with over 30% of deaths occurring in people >65 years of age (Jonkman et al., 2009; Diakakis et al., 2015).
In addition, the population of elderly people tends to be higher on some remote islands in The Bahamas, as working age people often move to the capital city for access to more jobs. Nature-based solutions provide valuable co-benefits such as food (e.g., fisheries) that may be critical relief in disaster contexts where communities are entirely dependent on local resources for subsistence. Building this type of self-sufficiency is a pillar of disaster risk reduction and sustainable development for island nations like The Bahamas where many vulnerable communities remain beyond the reach of rapid assistance after a disaster (Shultz et al., 2016, 2018). Partly in response to the devastation associated with recent hurricane seasons, the need to build coastal resilience is increasingly being recognized as a national priority for the security of Bahamian communities. As a result, building capacity and providing guidance around when and where to implement sustainable coastal protection is an important focus of ongoing island-scale and national planning efforts (Arkema and Ruckelshaus, 2017; Arkema K. et al., 2017; Lemay et al., 2017; Office of the Prime Minister of The Bahamas [OPM], 2017).
Following Hurricanes Joaquin (2015) and Matthew (2016), which caused hundreds of millions of dollars in damages across The Bahamas, decision-makers from a variety of agencies became interested in how our national maps of coastal risk and ecosystems could help inform their post-disaster reconstruction and resiliency building efforts. Training in spatial planning and integrated management approaches were also identified as priorities (Caribbean Coastal Services LTD [CCS], and SEV Consulting Group, 2016). In response, we developed an online interface to easily share the results from this study and to train non-scientists in the modeling approach and tools2. We then used these materials in a week-long workshop to engage Bahamians from diverse sectors, including emergency management, the department of works, and tourism and statistics, among others. Representatives from the Ministry of Works found that the risk assessment could help inform placement of roads, water mains, electrical lines, and other infrastructure in a way that would minimize future damage potential. The National Emergency Management Agency (NEMA) found these national-scale results could help inform disaster preparedness efforts in less studied regions of the country (The Tribune, 2016; Environmental Resources Management Inc [ERM], 2017). Our hazard analysis and custom visualization tool provides a national-scale dataset for mapping risk throughout The Bahamas and for supporting the development of comprehensive and effective science-based policies that reduce risk. Building capacity among decision-makers to engage directly with the inputs and outputs of models is a crucial step toward trust and ownership of results that has been found to be essential for their uptake (Clark et al., 2011; Ruckelshaus et al., 2013; Clark et al., 2016).
In a parallel effort, the Government of The Bahamas and the Inter-American Development Bank (IDB) used the results from the coastal hazard analysis to help inform the development of a Climate-Resilient Coastal Management and Infrastructure Program. The program, financed by a United States $35 million loan from the IDB, is funding pilot projects on several islands (Lemay et al., 2017), including on the island of Andros where mangrove restoration will be evaluated as a natural coastal protection strategy. At the time of the loan, the authors of this study had been working on Andros for several years to design a sustainable development plan (Arkema and Ruckelshaus, 2017; Office of the Prime Minister of The Bahamas [OPM], 2017). The outcome of the planning process was a roadmap communicating stakeholder desires for investments in infrastructure that would draw on and leverage the island’s wealth of natural resources (Office of the Prime Minister of The Bahamas [OPM], 2017), such as the natural-based coastal protection to be financed by the IDB loan. To inform the loan, we used the hazard index as a screening tool to identify high risk, populated areas where mangrove restoration had the potential to provide a cost-effective natural approach to coastal protection (Arkema K. et al., 2017). This was followed by physics-based wave modeling (Roelvink et al., 2010) to quantify the extent of mangrove needed to attenuate waves under different storm conditions and to inform approximate project costs (Arkema K. et al., 2017). Using multiple models to address management questions at different scales, we were able to understand where and under what conditions ecosystems were most appropriate while responding to the short timeline required for the project feasibility assessment. Thus, this study is a promising example for other communities and countries of how application of relatively simple models that link social, ecological, and physical science can be used to inform on-the-ground implementation of investments in ecosystem-based projects for coastal risk reduction.
A third outcome of this study was an opportunity to strengthen the knowledge base of local communities about risks from coastal hazards, climate adaptation, and natural solutions. For example, the settlement of Lowe Sound located at the northern tip of Andros was devastated by the 4.5 m storm surge of Hurricane Matthew. Many years ago when a coastal road was put in, all the mangroves were cleared and a small, approximately 0.6 m seawall was put in to stabilize the shoreline in place of the vegetation. Lowe Sound was identified in the results from our hazard analysis as one of the most exposed locations in the entire country, driven by high storm surge potential, low-lying elevation, and the absence of buffering ecosystems. Residents were shocked to learn that the shallow bank, which they had thought provided protection against storms, actually made them uniquely vulnerable to storm surge. This highlights the importance of educating people living in high risk areas with regard to drivers of coastal hazard. It also underscores the importance of engaging communities in solutions to hazards and climate change (Clark et al., 2011, 2016; Scyphers et al., 2015), such as the IDB loan to finance mangrove restoration. Of course mangrove restoration and conservation, like all nature-based and traditional coastal protection strategies, have their limitations. And as storm size increases, habitats may have less influence on water flow and/or be more likely to be themselves destroyed by the force of waves and surge. Given this, multiple strategies are needed. As climate impacts increase, relocation is anticipated to be part of a comprehensive climate adaptation strategy for many small island developing states (SIDS) (Nansen Initiative, 2015; Mycoo, 2017). However, few nations have policy guidelines to govern the process, and most SIDS currently take an ad hoc approach to relocation without considering exposure of the new settlement locations (Mycoo, 2017; Thomas and Benjamin, 2018). Our analysis and approach can help to provide what is missing in many countries – local geospatial data mapping vulnerability for identifying high risk areas (Thomas and Benjamin, 2018) and for engaging communities in developing socially and biophysically feasible solutions.
The transparency of modeled inputs and outputs, and the ability to quickly test different climate and development scenarios make the InVEST Coastal Vulnerability model an effective tool to engage with stakeholders and communicate with scientists and non-scientists alike (Arkema et al., 2013; Langridge et al., 2014; Hopper et al., 2016; Arkema K. K. et al., 2017; Cabral et al., 2017; Office of the Prime Minister of The Bahamas [OPM], 2017). However, there are also several important limitations with the approach. For example, using a proxy for surge potential may oversimplify storm dynamics, especially as they relate to superstorm-supersurge expectations, which could mishandle exposure and vulnerability of certain coastal areas. Furthermore, the dynamics associated with major storms are complex and can result in unexpected scenarios such as the negative surge associated with hurricane Irma (Revesz, 2017). The habitat ranks represent differences in their relative ability to attenuate water flow, but these are based on literature review and ultimately lack information about specific mechanisms and robust empirical validation. The index is most appropriate for understanding relative differences in risk reduction provided by ecosystems along the shoreline and requires assumptions about how far inland exposure to hazards will propagate. We also limited our exploration of climate impacts to sea-level rise alone when in fact many more climate variables, including changes in the intensity and frequency of storms, effects of ocean acidification and warming on reefs, are likely to influence risk to coastal hazards. Lastly, many factors have been identified as key drivers of social vulnerability, such as gender, livelihood, social capital, and wealth (Cutter et al., 2003; Boruff et al., 2005; Peacock et al., 2012; Rhiney, 2015; Ghosal, 2016; Arkema K. K. et al., 2017). We chose to focus on age, in part due to data availability, but care should be taken when interpreting the results to understand that this is only one dimension of vulnerability.
While it is important to consider these limitations, several studies have found good correspondence between areas of high risk, as estimated by the coastal vulnerability model and empirical data on impacts from coastal hazards (Arkema et al., 2013; Cabral et al., 2017). In the United States the states with the most at-risk populations as estimated by the model were also those states with the highest number of fatalities from storms over a 10-year time period (Arkema et al., 2013). In Mozambique, the most exposed districts tended to experience the greatest damages and human fatalities over a 30 year period (UNISDR, 2016; Cabral et al., 2017). And in this study, two of the areas most impacted by Hurricane Matthew – the southern coast of New Providence and the northern tip of Andros – are some of the highest risk locations according to modeled results (Figure 6, see Lowe Sound in Discussion, Caribbean Disaster Emergency Management Agency [CDEMA], 2016a,b,c,d; Pacific Disaster Center [PDC], 2016). These comparisons lend weight to our results for The Bahamas and in general indicate that the coastal vulnerability model is a robust, yet methodologically simple approach which can be applied even in data-scarce areas to help decision-makers understand where nature-based solutions may be feasible in their region under different conditions.
Conclusion
This study demonstrates an accessible approach and tools to produce a spatially explicit national-scale assessment of coastal hazard risk for The Bahamas, and to identify where coastal and marine habitats provide protection to vulnerable communities, now and under future SLR. We found that coastal and marine ecosystems in The Bahamas play a substantial role in protecting communities from coastal hazards, and will become more important as sea levels rise. The results were used to support on-the-ground efforts to build coastal resilience in The Bahamas and to provide training and build capacity for Bahamians from key sectors. The modeling approach and assessment we report on here also has value for international initiatives, especially as new technologies make coordinated data collection and sharing more feasible across the globe (United Nations Office for Disaster Risk Reduction [UNDRR], 2019). Our methods could be useful to UN member states, which through the Sendai Framework (UNISDR, 2015), aim to reduce disaster risk and losses of lives, livelihoods, and infrastructure. As another example, our results highlight approaches for operationalizing the Sustainable Development Goals through leveraging ecosystems for climate mitigation, adaptation, and coastal resilience. Importantly, our study serves as an encouraging example for other regions and countries seeking to assess and implement nature-based approaches to risk reduction for vulnerable coastal populations.
Data Availability
The datasets generated for this study are available at https://doi.org/10.5281/zenodo.3387713.
Author Contributions
KA and MR conceived the research. JS, RG, SS, SHM, SM, KW, GV, and KA prepared the data and conducted the analysis. JS and KA prepared the manuscript with contributions from SM, SHM, SS, AT, BL, ML, MR, KW, GV, and RG. GV and KA developed the hazard index. GV, with guidance from JS, created an online portal to host the results, which was used in training. BL, ML, SHM, and AT provided guidance, vetted the results, and were key partners in the decision-making processes discussed in this manuscript.
Funding
This work was funded by the Biodiversity and Ecosystem Services Program at the Inter-American Development Bank (BH-T1040).
Conflict of Interest Statement
ML was employed by the Inter-American Development Bank.
The remaining authors declare that the research was conducted in the absence of any commercial or financial relationships that could be construed as a potential conflict of interest.
Acknowledgments
Many thanks to Nicola Rolle in the Office of the Prime Minister for guidance and support over the course of our work in The Bahamas. John Knowles and Shenique Albury-Smith of TNC Caribbean Office provided data for the analysis. Michelle Lakin of Blue Engineering collaborated on the analysis to inform the IDB natural infrastructure loan and provided valuable guidance. Rochelle Newbold of SEV Consulting helped to collect the field data to support both 1D modeling for the IDB loan, as well as stakeholder engagement for scenario design for the Andros Sustainable Develop Effort. Dave Fisher of The Natural Capital Project helped to conduct the analysis. Special thanks to Gregory Guannel for his work in developing the coastal hazard index.
Footnotes
- ^ http://status.pr/ (Retrieved Febuary 13, 2018).
- ^ http://marineapps.naturalcapitalproject.org/bahamas/
References
Adger, W. N., Hughes, T. P., Folke, C., Carpenter, S. R., and Rockstrom, J. (2005). Socio-ecological resilience to coastal disasters. Science 309, 1036–1039. doi: 10.1126/science.1112122
Alongi, D. (2008). Mangrove forests: resilience, protection from tsunamis, and responses to global climate change. Estuar. Coast. Shelf Sci. 76, 1–13. doi: 10.1016/j.ecss.2007.08.024
Andréfouët, S., Muller-Karger, F., Robinson, J., Kranenburg, C., Torres-Pulliza, D., Spraggins, S., et al. (2006). “Global assessment of modern coral reef extent and diversity for regional science and management applications: a view from space,” in Proceedings of the 10th International Coral Reef Symposium, Okinawa, 1732–1745.
Anthoff, D., Nicholls, R. J., and Tol, R. S. (2010). The economic impact of substantial sea-level rise. Mitig. Adapt. Strateg. Glob. Change 15, 321–335. doi: 10.1007/s11027-010-9220-7
Arkema, K., and Ruckelshaus, M. (2017). “Transdisciplinary research for conservation and sustainable development planning in the Caribbean,” in Conservation in the Anthropocene Ocean: Interdisciplinary Science in Support of Nature and People, eds P. Levin and M. Poe (San Diego, CA: Elsevier).
Arkema, K., Fischer, D., Griffin, R., Rogers, L., Ruckelshaus, M., Silver, J., et al. (2017). BH-T1040: Ecosystem-Based Development for Andros Island. Natural Capital Project Final Report to the Inter-American Development Bank. Washington, DC: Inter-American Development Bank.
Arkema, K. K., Griffin, R., Maldonado, S., Silver, J., Suckale, J., and Guerry, A. D. (2017). Linking social, ecological, and physical science to advance natural and nature-based protection for coastal communities. Ann. N. Y. Acad. Sci. 1399, 5–26. doi: 10.1111/nyas.13322
Arkema, K. K., Guannel, G., Verutes, G., Wood, S. A., Guerry, A., Ruckelshaus, M., et al. (2013). Coastal habitats shield people and property from sea-level rise and storms. Nat. Clim. Change 3, 913–918. doi: 10.1038/nclimate1944
Ascertainment of the estimated excess mortality from Hurricane Maria in Puerto Rico (2018). Project Report. Milken Institute School of Public Health, The George Washington University and The University of Puerto Rico Graduate School of Public Health. Available at: https://drive.google.com/file/d/16X9qtnPaD–2dPhpcwu7S53esafH59i9/preview (accessed February 15, 2019).
Bahamas Department of Statistics (2017). 2010 Census of Population and Housing, 1st Release. Nassau: The Commonwealth of The Bahamas.
Barbier, E. B. (2015). Valuing the storm protection service of estuarine and coastal ecosystems. Ecosyst. Ser. 11, 32–38. doi: 10.1016/j.marpolbul.2016.01.033
Barbier, E. B., Koch, E., Silliman, B., Hacker, S., Wolanski, E., Primavera, J., et al. (2008). Coastal ecosystem-based management with nonlinear ecological functions and values. Science 319, 321–323. doi: 10.1126/science.1150349
Beck, M., Losada, I., Menéndez, P., Reguero, B., Díaz-Simal, P., and Fernández, F. (2018). The global flood protection savings provided by coral reefs. Nat. Commun. 9:2186. doi: 10.1038/s41467-018-04568-z
Boruff, B. J., Emrich, C., and Cutter, S. L. (2005). Erosion hazard vulnerability of U.S. coastal counties. J. Coast. Res. 215, 932–942. doi: 10.2112/04-0172.1
Boutwell, J. L., and Westra, J. V. (2016). The role of wetlands for mitigating economic damage from Hurricanes. J. Am. Water Resour. Assoc. 52, 1472–1481. doi: 10.1038/s41598-018-21217-z
Burgess, K., Jay, H., and Hosking, A. (2004). Future coast: predicting the future coastal evolution of England and Wales. J. Coast. Conserv. 10, 65–71. doi: 10.1007/bf02818943
Cabral, P., Augusto, G., Akande, A., Costa, A., Amade, N., Niquisse, S., et al. (2017). Assessing mozambique’s exposure to coastal climate hazards and erosion. Int. J. Disaster Risk Reduct. 23, 45–52. doi: 10.1016/j.ijdrr.2017.04.002
Caribbean Coastal Services LTD [CCS], and SEV Consulting Group. (2016). Consulting Services to Prepare a National Integrated Coastal Zone Management Policy Framework for The Bahamas and Phase 1 Dissemination. Nassau: Caribbean Coastal Services.
Caribbean Disaster Emergency Management Agency [CDEMA] (2016a). Bahamas: Hurricane Matthew Rapid Assessment Housing Damage Estimate New Providence 8-11 Oct 2016. Available at: https://maps.mapaction.org/dataset/7ff6c9a2-1e6e-4549-9e23-8bddb8865868/resource/eae82375-e163-4605-9031-5d4824872bac/download/ma010assessmentresultsesthousedamage-300dpi.pdf (accessed January 26, 2017).
Caribbean Disaster Emergency Management Agency [CDEMA] (2016b). Draft Rapid Needs Assessment Teams for the Commonwealth of The Bahamas. Saint Michael: CDEMA.
Caribbean Disaster Emergency Management Agency [CDEMA] (2016c). Rapid Needs Assessment of Grand Bahama, The Commonwealth of The Bahamas RNAT Report Following the Passage of Hurricane Matthew between the 9 to 11 October, 2016. Saint Michael: CDEMA.
Caribbean Disaster Emergency Management Agency [CDEMA] (2016d). Rapid Needs Assessment Report North Andros Island – Bahamas. Saint Michael: CDEMA.
Center for International Earth Science Information Network [CIESIN], and Columbia University. (2013). Urban-Rural Population and Land Area Estimates Version 2. Palisades, NY: NASA Socioeconomic Data and Applications Center (SEDAC).
Cheong, S. M., Silliman, B., Wong, P. P., Van Wesenbeeck, B., Kim, C. K., and Guannel, G. (2013). Coastal adaptation with ecological engineering. Nat. Clim. Change 3, 787–791. doi: 10.1038/nclimate1854
CIA World Factbook (2017). “The Bahamas.” Available at: https://www.cia.gov/library/publications/resources/the-world-factbook/geos/bf.html (accessed February 15, 2018).
Clark, W. C., Tomich, T. P., van Noordwijk, M., Guston, D., Catacutan, D., and Dickson, N. M. (2011). Knowledge systems for sustainable development special feature Sackler Colloquium: boundary work for sustainable development: natural resource management at the consultative group on international agricultural research (CGIAR). Proc. Natl. Acad. Sci. U.S.A. 113, 4615–4622. doi: 10.1073/pnas.0900231108
Clark, W. C., Van Kerkhoff, L., Lebel, L., and Gallopin, G. C. (2016). Crafting usable knowledge for sustainable development. Proc. Natl. Acad. Sci. U.S.A. 113, 4570–4578. doi: 10.1073/pnas.1601266113
Cooper, J., and McLaughlin, S. (1998). Contemporary multidisciplinary approaches to coastal classification and environmental risk analysis. J. Coast. Res. 14, 512–524.
Costanza, R., Pérez-Maqueo, O., Martinez, M. L., Sutton, P., Anderson, S. J., and Mulder, K. (2008). The value of coastal wetlands for Hurricane protection. Ambio 37, 241–248. doi: 10.1579/0044-7447(2008)37%5B241:tvocwf%5D2.0.co;2
Cutter, S. L., Boruff, B. J., and Shirley, W. L. (2003). Social vulnerability to environmental hazards. Soc. Sci. Q. 84, 242–261.
Cutter, S. L., Emrich, C. T., Webb, J. J., and Morath, D. (2009). Social Vulnerability to Climate Variability Hazards: A Review of the Literature. Boston, MA: Oxfam America.
Danielsen, F., Sorensen, M. K., Olwig, M. F., Selvam, V., Parish, F., Burgess, N. D., et al. (2005). The Asian tsunami: a protective role for coastal vegetation. Science 310:643. doi: 10.1126/science.1118387
Das, S., and Vincent, J. R. (2009). Mangroves protected villages and reduced death toll during indian super cyclone. Proc. Natl. Acad. Sci. U.S.A. 106, 7357–7360. doi: 10.1073/pnas.0810440106
Diakakis, M., Deligiannakis, G., Katsetsiadou, K., and Lekkas, E. (2015). Hurricane Sandy mortality in the Caribbean and continental North America. Disaster Prev. Manag. 24, 132–148. doi: 10.1108/dpm-05-2014-0082
Dundas, S. J. (2017). Benefits and ancillary costs of natural infrastructure: evidence from the New Jersey coast. J. Environ. Econ. Manag. 85, 62–80. doi: 10.1016/j.jeem.2017.04.008
EM-DAT International Disaster Database (2018). Global database on natural and technological disasters EM-DAT. Brussels: The Centre for Research on the Epidemiology of Disasters (CRED).
Environmental Resources Management Inc [ERM] (2017). Sustainable Nassau Action Plan, Hazard and Risk Study. Washington, DC: Environmental Resources Management Inc.
ESRI (2012). “Ocean” [Basemap]. ∼1:577K. “Ocean Basemap”. Available at: http://www.arcgis.com/home/item.html?id=5ae9e138a17842688b0b79283a4353f6 (accessed January 30, 2018).
Ferrario, F., Beck, M., Storlazzi, C., Micheli, F., Shepard, C., and Airoldi, L. (2014). The effectiveness of coral reefs for coastal hazard risk reduction and adaptation. Nat. Commun. 5:3794. doi: 10.1038/ncomms4794
Ghosal, R. D. (2016). Climate change in the Caribbean: a multi-scalar account of context and inequality. J. Crit. Thought Praxis 5:2.
Gittman, R., Fodrie, F., Popowich, A., Keller, D., Bruno, J., Currin, C. A., et al. (2015). Engineering away our natural defenses: an analysis of shoreline hardening in the US. Front. Ecol. Environ. 13:301–307. doi: 10.1890/150065
Gornitz, V. (1990). Vulnerability of the east coast, U.S.A. to future sea level rise. J. Coast. Res. 9, 201–237. doi: 10.1007/s10661-017-6282-y
Guannel, G., Arkema, K., Ruggiero, P., and Verutes, G. (2016). The power of three: coral reefs, Seagrasses and mangroves protect coastal regions and increase their resilience. PLoS One 11:e0158094. doi: 10.1371/journal.pone.0158094
Hallegatte, S., Green, C., Nicholls, R. J., and Corfee-Morlot, J. (2013). Future flood losses in major coastal cities. Nat. Clim. Change. 3, 802–806. doi: 10.1111/risa.13285
Hammar-Klose, E. S., and Thieler, E. R. (2001). Coastal Vulnerability to Sea-Level Rise: A Preliminary Database for the U.S. Atlantic, Pacific, and Gulf of Mexico Coasts. Reston, VA: U.S. Geological Survey.
Henderson, J. V., Storeygard, A., and Weil, D. N. (2011). A bright idea for measuring economic growth. Am. Econ. Rev. 101, 194–199. doi: 10.1257/aer.101.3.194
Hillen, M. M., Jonkman, S. N., Kanning, W., Kok, M., Geldenhuys, M. A., and Stive, M. J. F. (2010). Coastal Defence Cost Estimates: Case Study of the Netherlands, New Orleans and Vietnam. Communications on Hydraulic and Geotechnical Engineering 2010-01. Delft: Delft University of Technology.
Hincks, J. (2017). Here are the Disturbing Numbers on Puerto Rico One Month After Hurricane Maria. Available at: http://time.com/4988841/puerto-rico-hurricane-maria-numbers-recovery/ (accessed February 13, 2018).
Hinkel, J., Lincke, D., Vafeidis, A., Perrette, M., Nicholls, R., Tol, R., et al. (2014). Coastal flood damage and adaptation costs under 21st century sea-level rise. Proc. Natl. Acad. Sci. U.S.A. 111, 3292–3297. doi: 10.1073/pnas.1222469111
Hopper, T., Hewitt, J., and Meixler, M. S. (2016). Modeling coastal vulnerability through space and time. PLoS One 11:E0163495. doi: 10.1371/journal.pone.0163495
Jones, H. P., Hole, D. G., and Zavaleta, E. S. (2012). Harnessing nature to help people adapt to climate change. Nat. Clim. Change 2, 504–509. doi: 10.1038/nclimate1463
Jonkman, S., Maaskant, B., Boyd, E., and Levitan, M. (2009). Loss of life caused by the flooding of New Orleans after Hurricane Katrina: analysis of the relationship between flood characteristics and mortality. Risk Anal. 29, 676–698. doi: 10.1111/j.1539-6924.2008.01190.x
Kishore, N., Marqués, D., Mahmud, A., Kiang, M., Rodriguez, I., Fuller, A., et al. (2018). Mortality in Puerto Rico after Hurricane Maria. N. Engl. J. Med. 379:e30. doi: 10.1056/NEJMsa1803972
Knowles, J., Green, A., Dahlgren, C., Arnett, F., and Knowles, L. (2017). Expanding The Bahamas Marine Protected Area Network to Protect 20% of the Marine and Coastal Environment by 2020: A Gap Analysis. Nassau: The Nature Conservancy.
Koch, E. W., Barbier, E. B., Silliman, B. R., Reed, D. J., Perillo, G. M., Hacker, S. D., et al. (2009). Non-linearity in ecosystem services: temporal and spatial variability in coastal protection. Front. Ecol. Environ. 7:29–37. doi: 10.1890/080126
Koks, E. E., Jongman, B., Husby, T. G., and Botzen, W. J. W. (2015). Combining hazard, exposure and social vulnerability to provide lessons for flood risk management. Environ. Sci. Policy 47, 42–52. doi: 10.1016/j.envsci.2014.10.013
Kron, W. (2013). Coasts: the high-risk areas of the world. Nat. Hazards 66, 1363–1382. doi: 10.1093/ije/dyw366
Landry, C., Hindsley, P., Bin, O., Kruse, J., Whitehead, J., and Wilson, K. (2011). Weathering the storm: measuring household willingness-to-pay for risk-reduction in post-Katrina New Orleans. South. Econ. J. 77, 991–1013. doi: 10.4284/0038-4038-77.4.991
Landwehr, J. M., and Deininger, R. A. (1976). A comparison of several water quality indexes. J. Water Pollut. Control Fed. 48, 954–958.
Langridge, S. M., Hartge, E. H., Clark, R., Arkema, K., Verutes, G. M., Prahler, E. E., et al. (2014). Key lessons for incorporating natural infrastructure into regional climate adaptation planning. Ocean Coast. Manag. 95, 189–197. doi: 10.1016/j.ocecoaman.2014.03.019
Lemay, M., Schueler, K., Hori, T., Guerrero, R., Argimon, M., Chavez, E., et al. (2017). Climate-Resilient Coastal Management and Infrastructure Program, Project Profile (BH-L1043). Washington, DC: Inter-American Development Bank.
Marine Spatial Ecology Lab [MSEL] (2005). [Coral Reef]. Ian Elliott; Esri ArcGIS. Queensland: University of Queensland.
McGranahan, G., Balk, D., and Anderson, B. (2007). The rising tide: assessing the risks of climate change and human settlements in low elevation coastal zones. Environ. urban. 19, 17–37. doi: 10.1177/0956247807076960
Moss, S., and Moultrie, S. (2014). Ecological Gap Analysis: GEF FSP Sustainable Network of MPAs – The Bahamas. Nassau: BEST Commission, 60.
Moultrie, S., Deleveaux, E., Bethel, G., Laurent, Y., d’Shan Maycock, V., Moss-Hackett, S., et al. (2016). “Fisheries and aquaculture in the bahamas: a review,” in Food and Agriculture Organization of the United Nations/Department of Marine Resources Nassau, the Bahamas. Available at: https://www.bahamas.gov.bs/wps/wcm/connect/e1d636dd-1a9b-4661-9e38-ba9bf546a534/FINAL+Bahamas+Fisheries+%26+Aquaculture+Sector+Review+17Nov16.pdf?MOD=AJPERES
Mycoo, M., and Donovan, M. (2017). A Blue Urban Agenda: Adapting to Climate Change in the Coastal Cities of Caribbean and Pacific Small Island Developing States. Washington, DC: Inter-American Development Bank (IDB).
Mycoo, M. A. (2017). Beyond 1.5°C: vulnerabilities and adaptation strategies for Caribbean small island developing states. Reg. Environ. Change 18, 2341–2353. doi: 10.1007/s1011
Nansen Initiative, (2015). Disaster-Induced Cross-Border Displacement, Vol. 1. Geneva: Nansen Initiative.
Narayan, S., Beck, M. W., Reguero, B. G., Losada, I. J., van Wesenbeeck, B., Pontee, N., et al. (2016). The effectiveness, costs and coastal protection benefits of natural and nature-based defences. PLoS One 11:e0154735. doi: 10.1371/journal.pone.0154735
NASA LP DAAC, (2014). Shuttle Radar Topography Mission (SRTM) Dataset. Version 3. Sioux Falls, SD: NASA EOSDIS Land Processes DAAC.
National Oceanic and Atmospheric Administration [NOAA], (2011). Nighttime Lights Annual Composites. Version 4. Available at: https://www.ngdc.noaa.gov/eog/dmsp/downloadV4composites.html (accessed January, 2017).
National Oceanic and Atmospheric Administration [NOAA] and National Hurricane Center [NHC], (2018). Costliest U.S. Tropical Cyclones Tables Updated. Available at: https://www.nhc.noaa.gov/news/UpdatedCostliest.pdf (accessed January, 2019).
Neumann, B., Vafeidis, A. T., Zimmermann, J., and Nicholls, R. (2015). Future coastal population growth and exposure to sea-level rise and coastal flooding—a global assessment. PLoS One 10:e0118571. doi: 10.1371/journal.pone.0118571
Nicholls, R., Hanson, S., Herweijer, C., Patmore, N., Hallegatte, S., Corfee-Morlot, J., et al. (2008). Ranking Port Cities with High Exposure and Vulnerability to Climate Extremes: Exposure Estimates. OECD Environment Working Papers, No. 1. Paris: OECD Publishing, doi: 10.1787/011766488208
Nurse, L. A., McLean, R. F., Agard, J., Briguglio, L. P., Duvat-Magnan, V., Pelesikoti, N., et al. (2014). “Small islands,” in AR5 Climate Change 2014: Impacts, Adaptation, and Vulnerability. Part B: Regional Aspects. Contribution of Working Group II to the Fifth Assessment Report of the Intergovernmental Panel on Climate Change, eds V. R. Barros, C. B. Field, D. J. Dokken, M. D. Mastrandrea, K. J. Mach, T. E. Bilir, et al. (Cambridge: Cambridge University Press), 1613–1654.
Office of the Prime Minister of The Bahamas [OPM] (2017). Sustainable Development Master Plan for Andros Island. Washington, DC: Inter-American Development Bank.
Pacific Disaster Center [PDC] (2016). Hurricane Matthew – Preliminary Damage Assessment New Providence. Available at: https://reliefweb.int/map/bahamas/hurricane-matthew-preliminary-damage-assessment-new-providence-bahamas-07-oct-2016 (accessed October 7, 2016).
Panditharante, M. (2018). Puerto Rico Needs More Than Bandages, The New York Times, Published Feb 12, 2018. Available at: https://www.nytimes.com/2018/02/12/opinion/puerto-rico-water-electricity.html (accessed February 13, 2018).
Parris, A., Bromirski, P., Burkett, V., Cayan, D., Culver, M., Hall, J., et al. (2012). Global Sea Level Rise Scenarios for the US National Climate Assessment. National Oceanic and Atmospheric Administration Tech Memo OAR CPO-1. Silver Spring, MD: NOAA, 37.
Pasch, R., Penny, A., and Berg, R. (2019). National Hurricane Center Tropical Cyclone Report, Hurricane Maria. AL152017. Availabe at: https://www.nhc.noaa.gov/data/tcr/AL152017_Maria.pdf (accessed February 15, 2019).
Peacock, W. G., Van Zandt, S., Henry, D., Grover, H., and Highfield, W. (2012). “Using social vulnerability mapping to enhance coastal community resiliency in Texas,” in Lessons from Hurricane Ike, eds P. Bedient, P. Bedient, and J. Blackburn (College Station, TX: Texas A&M Press), 66–81.
Puerto Rico: The Forgotten Island (2018). Miami Herald. Available at: https://www.miamiherald.com/news/nation-world/national/article217659345.html (accessed January 23, 2019).
Rangel-Buitrago, N., Williams, A., and Anfuso, G. (2017). Hard protection structures as a principal coastal erosion management strategy along the Caribbean coast of Colombia. A chronicle of pitfalls. Ocean Coast. Manag. 156, 58–75. doi: 10.1016/j.ocecoaman.2017.04.006
Reguero, B. G., Beck, M. W., Agostini, V. N., Kramer, P., and Hancock, B. (2018a). Coral reefs for coastal protection: a new methodological approach and engineering case study in Grenada. J. Environ. Manag. 210, 146–161. doi: 10.1016/j.jenvman.2018.01.024
Reguero, B. G., Beck, M. W., Bresch, D., Calil, J., and Meliane, I. (2018b). Comparing the cost effectiveness of nature-based and coastal adaptation: a case study from the Gulf Coast of the United States. PLoS One 13:e0192132. doi: 10.1371/journal.pone.0192132
Reguero, B. G., Losada, I. J., Díaz-Simal, P., Méndez, F. J., and Beck, M. W. (2015). Effects of climate change on exposure to coastal flooding in Latin America and the Caribbean. PLoS One 10:e0133409. doi: 10.1371/journal.pone.0133409
Resio, D. T., and Westerink, J. J. (2008). Modeling the physics of storm surges. Phys. Today 61:33. doi: 10.1063/1.2982120
Revesz, R. (2017). Irma: Hurricane Sucks Water from Bahamas Beach in Rare Phenomenon. Available at: https://www.independent.co.uk/news/uk/home-news/hurricane-irma-hits-florida-cuba-bahamas-sucks-water-beach-dry-category-5-a7938701.html (accessed January 16, 2019).
Rhiney, K. (2015). Geographies of Caribbean vulnerability in a changing climate: issues and trends. Geogr. Comp. 9, 97–114. doi: 10.1111/gec3.12199
Rodríguez-Díaz, C. E. (2018). Maria in Puerto Rico: natural disaster in a colonial archipelago. Am. J. Public Health. 108, 30–32. doi: 10.2105/AJPH.2017.304198
Roelvink, J. A., Reniers, A., van Dongeren, A., de Vries, J., Lescinski, J., and McCall, R. (2010). XBeach Model Description and Manual. Delft: UNESCO-IHE Institute for Water Education, 106.
Rolle, A. (1990). A Storm Surge Atlas for the Northern and Central Bahamas. Miami, FL: U.S. National Hurricane Center, 22.
Ruckelshaus, M., Guannel, G., Arkema, K., Verutes, G., Griffin, R., Guerry, A., et al. (2016). Evaluating the benefits of green infrastructure for coastal areas: location, location, location. Coast. Manag. 44, 504–516. doi: 10.1080/08920753.2016.1208882
Ruckelshaus, M., McKenzie, E., Tallis, H., Guerry, A., Daily, G., Kareiva, P., et al. (2013). Notes from the field: lessons learned from using ecosystem service approaches to inform real-world decisions. Ecol. Econ. 115, 11–21. doi: 10.1016/j.ecolecon.2013.07.009
Scyphers, S. B., Picou, J. S., and Powers, S. P. (2015). Participatory conservation of coastal habitats: the importance of understanding homeowner decision making to mitigate cascading shoreline degradation. Conserv. Lett. 8, 41–49. doi: 10.1111/conl.12114
Sharp, R., Tallis, H. T., Ricketts, T., Guerry, A. D., Wood, S. A., Chaplin-Kramer, R., et al. (2018). InVEST +VERSION+ User’s Guide. Stanford, CA: Stanford University.
Shepard, C. C., Crain, C. M., and Beck, M. W. (2011). The protective role of Coastal Marshes: a systematic review and meta-analysis. PLoS One 6:e27374. doi: 10.1371/journal.pone.0027374
Shultz, J., Kossin, J., Shepherd, J., Ransdell, J., Walshe, R., Kelman, I., et al. (2018). Risks, health consequences, and response challenges for small-island-based populations: observations from the 2017 Atlantic Hurricane season. Disaster Med. Public Health Prep. 13, 5–17. doi: 10.1017/dmp.2018.28
Shultz, J. M., Cohen, M. A., Hermosilla, S., Espinel, Z., and McLean, A. (2016). Disaster risk reduction and sustainable development for small island developing states. Disaster Health 3, 32–44. doi: 10.1080/21665044.2016.1173443
Spalding, M. D., Ruffo, S., Meliane, I., Hale, L. Z., Lacambra, C. C. C., and Beck, M. W. (2014). The role of ecosystems in coastal protection: adapting to climate change and coastal hazards. Ocean Coast. Manag. 90, 50–57. doi: 10.1016/j.ocecoaman.2013.09.007
Swamee, P. K., and Tyagi, A. (2000). Describing water quality with aggregate index. J. Environ. Eng. 126, 451–455. doi: 10.1061/(asce)0733-9372(2000)126:5(451)
Temmerman, S., Meire, P., Bouma, T. J., Herman, P. M., Ysebaert, T., and De Vriend, H. J. (2013). Ecosystem-based coastal defence in the face of global change. Nature 504, 79–83. doi: 10.1038/nature12859
Thatcher, C. (2013). Economic vulnerability to sea-level rise along the Northern U.S. Gulf Coast. J. Coast. Res. 63, 234–243. doi: 10.2112/si63-017.1
The Nature Conservancy [TNC], and The National Coral Reef Institute [NCRI]. (2010). Andros Island Benthic Habitat. Submerged Vegetation. Dr. Sam Purkis; eCognition; Image segmentation and classification. Arlington County, VA: The Nature Conservancy.
The Nature Conservancy [TNC], and The University of South Florida (2007). The Bahamas Seagrass. Landsat 7 Classification. Arlington County, VA: The Nature Conservancy.
The Tribune (2016). “Nema “Strongly Advises” Evacuation from Yamacraw, Southern New Providence and Lyford Cay. Tribune 242, 5th, October, 2016.
Thomas, A., and Benjamin, L. (2018). Policies and mechanisms to address climate-induced migration and displacement in Pacific and Caribbean small island developing states. Int. J. Clim. Change Strateg. Manag. 10, 86–104.
Tolman, H. L. (2009). User Manual and System Documentation of WAVEWATCH III version 3.14. Camp Springs, MD: National Centers for Environmental Predictions.
UNEP-WCMC, WorldFish Centre, World Resources Institute [WRI], and The Nature Conservancy [TNC] (2010). Global distribution of warm-water coral reefs”, compiled from multiple sources including the Millennium Coral Reef Mapping Project. Version 2.0. Includes contributions from IMaRS-USF and IRD (2005), IMaRS-USF (2005) and Spalding et al. (2001). Cambridge: UN Environment World Conservation Monitoring Centre.
UNISDR (2015). “Sendai framework for disaster risk reduction 2015–2030,” in Proceedings of the 3rd United Nations World Conference on DRR, Sendai, 14–18.
UNISDR (2016). DesInventar, Disaster Information System. Geneva: United Nations Office for Disaster Risk Reduction.
United Nations Economic Commission for Latin America and the Caribbean [UNECLAC] (2014). Efectos del cambio climático en la costa de América Latina y el Caribe. Vulnerabilidad y exposición.” División de Desarrollo Sostenible y Asentamientos Humanos de la CEPAL. Available at: https://repositorio.cepal.org/bitstream/handle/11362/3982/1/S2012024_es.pdf (accessed January, 2019).
United Nations Office for Disaster Risk Reduction [UNDRR] (2019). Global Assessment Report on Disaster Risk Reduction. Geneva: United Nations Office for Disaster Risk Reduction (UNDRR).
Wamsley, T. V., Collier, Z. A., Brodie, K., Dunkin, L. M., Raff, D., and Rosati, J. D. (2015). Guidance for developing coastal vulnerability metrics. J. Coast. Res. 31, 1521–1530. doi: 10.2112/jcoastres-d-14-00015.1
Wong, P. P., Losada, I. J., Gattuso, J.-P., Hinkel, J., Khattabi, A., McInnes, K. L., et al. (2014). “Coastal systems and low-lying areas,” in AR5 Climate Change 2014: Impacts, Adaptation, and Vulnerability. Part A: Global and Sectoral Aspects. Contribution of Working Group II to the Fifth Assessment Report of the Intergovernmental Panel on Climate Change, eds C. B. Field, V. R. Barros, D. J. Dokken, K. J. Mach, M. D. Mastrandrea, T. E. Bilir, et al. (Cambridge: Cambridge University Press), 361–409.
World Resources Institute [WRI], (2004). Bathymetry Developed at WRI from Depth Point Data from the Danish Hydrologic Institute’s (DHI) C-MAP Data Product, Interpolated at 1-km Resolution. Washington, DC: World Resources Institute.
Keywords: coastal protection, coastal habitats, coastal hazards, ecosystem services, social vulnerability, sea level rise, The Bahamas, natural and nature-based features
Citation: Silver JM, Arkema KK, Griffin RM, Lashley B, Lemay M, Maldonado S, Moultrie SH, Ruckelshaus M, Schill S, Thomas A, Wyatt K and Verutes G (2019) Advancing Coastal Risk Reduction Science and Implementation by Accounting for Climate, Ecosystems, and People. Front. Mar. Sci. 6:556. doi: 10.3389/fmars.2019.00556
Received: 16 March 2019; Accepted: 23 August 2019;
Published: 24 September 2019.
Edited by:
Emanuele Di Lorenzo, Georgia Institute of Technology, United StatesReviewed by:
Nadia Pinardi, University of Bologna, ItalyHermann Marc Fritz, Georgia Institute of Technology, United States
Copyright © 2019 Silver, Arkema, Griffin, Lashley, Lemay, Maldonado, Moultrie, Ruckelshaus, Schill, Thomas, Wyatt and Verutes. This is an open-access article distributed under the terms of the Creative Commons Attribution License (CC BY). The use, distribution or reproduction in other forums is permitted, provided the original author(s) and the copyright owner(s) are credited and that the original publication in this journal is cited, in accordance with accepted academic practice. No use, distribution or reproduction is permitted which does not comply with these terms.
*Correspondence: Jessica M. Silver, jess.silver@stanford.edu; Katie K. Arkema, karkema@stanford.edu
†Present address: Robert M. Griffin, School of Marine Science and Technology, University of Massachusetts Dartmouth, New Bedford, MA, United States; Brett Lashley, King’s Business School, King’s College London, London, United Kingdom; Sergio Maldonado, Faculty of Engineering and Physical Sciences, University of Southampton, Southampton, United Kingdom